
*This post has been updated since being uploaded on June 2, 2021. The Stats Map for the Entire RAHB Market Area, Burlington Area Map, Haldimand Area Map, Hamilton Area Map, and Niagara North Area Map have been updated. Apologies for any inconvenience.*
The REALTORS® Association of Hamilton-Burlington (RAHB) reported 1,811 sales of residential properties located within the RAHB market area through the Multiple Listing Service® (MLS®) System in May 2021. While sales were down five per cent since last month, they were up 90 per cent since May 2020. New listings were down 14 per cent since last month and up 73 per cent as of last May. The average price for residential properties was $843,468 which was down one per cent from last month and up 29 per cent from May 2020. The inventory available at the end of the month was 0.6 per cent lower than last month.
*The news release will be posted to www.rahb.ca/market-stats/ on Thursday, June 3.*
Follow the links below for:
- Residential Market Activity for RAHB Area
- All RAHB Residential Market Activity and HPI Report (17 pages)
- RAHB Residential Market at a Glance
- Weekly Trends During COVID-19
- Social Media Stats Kit
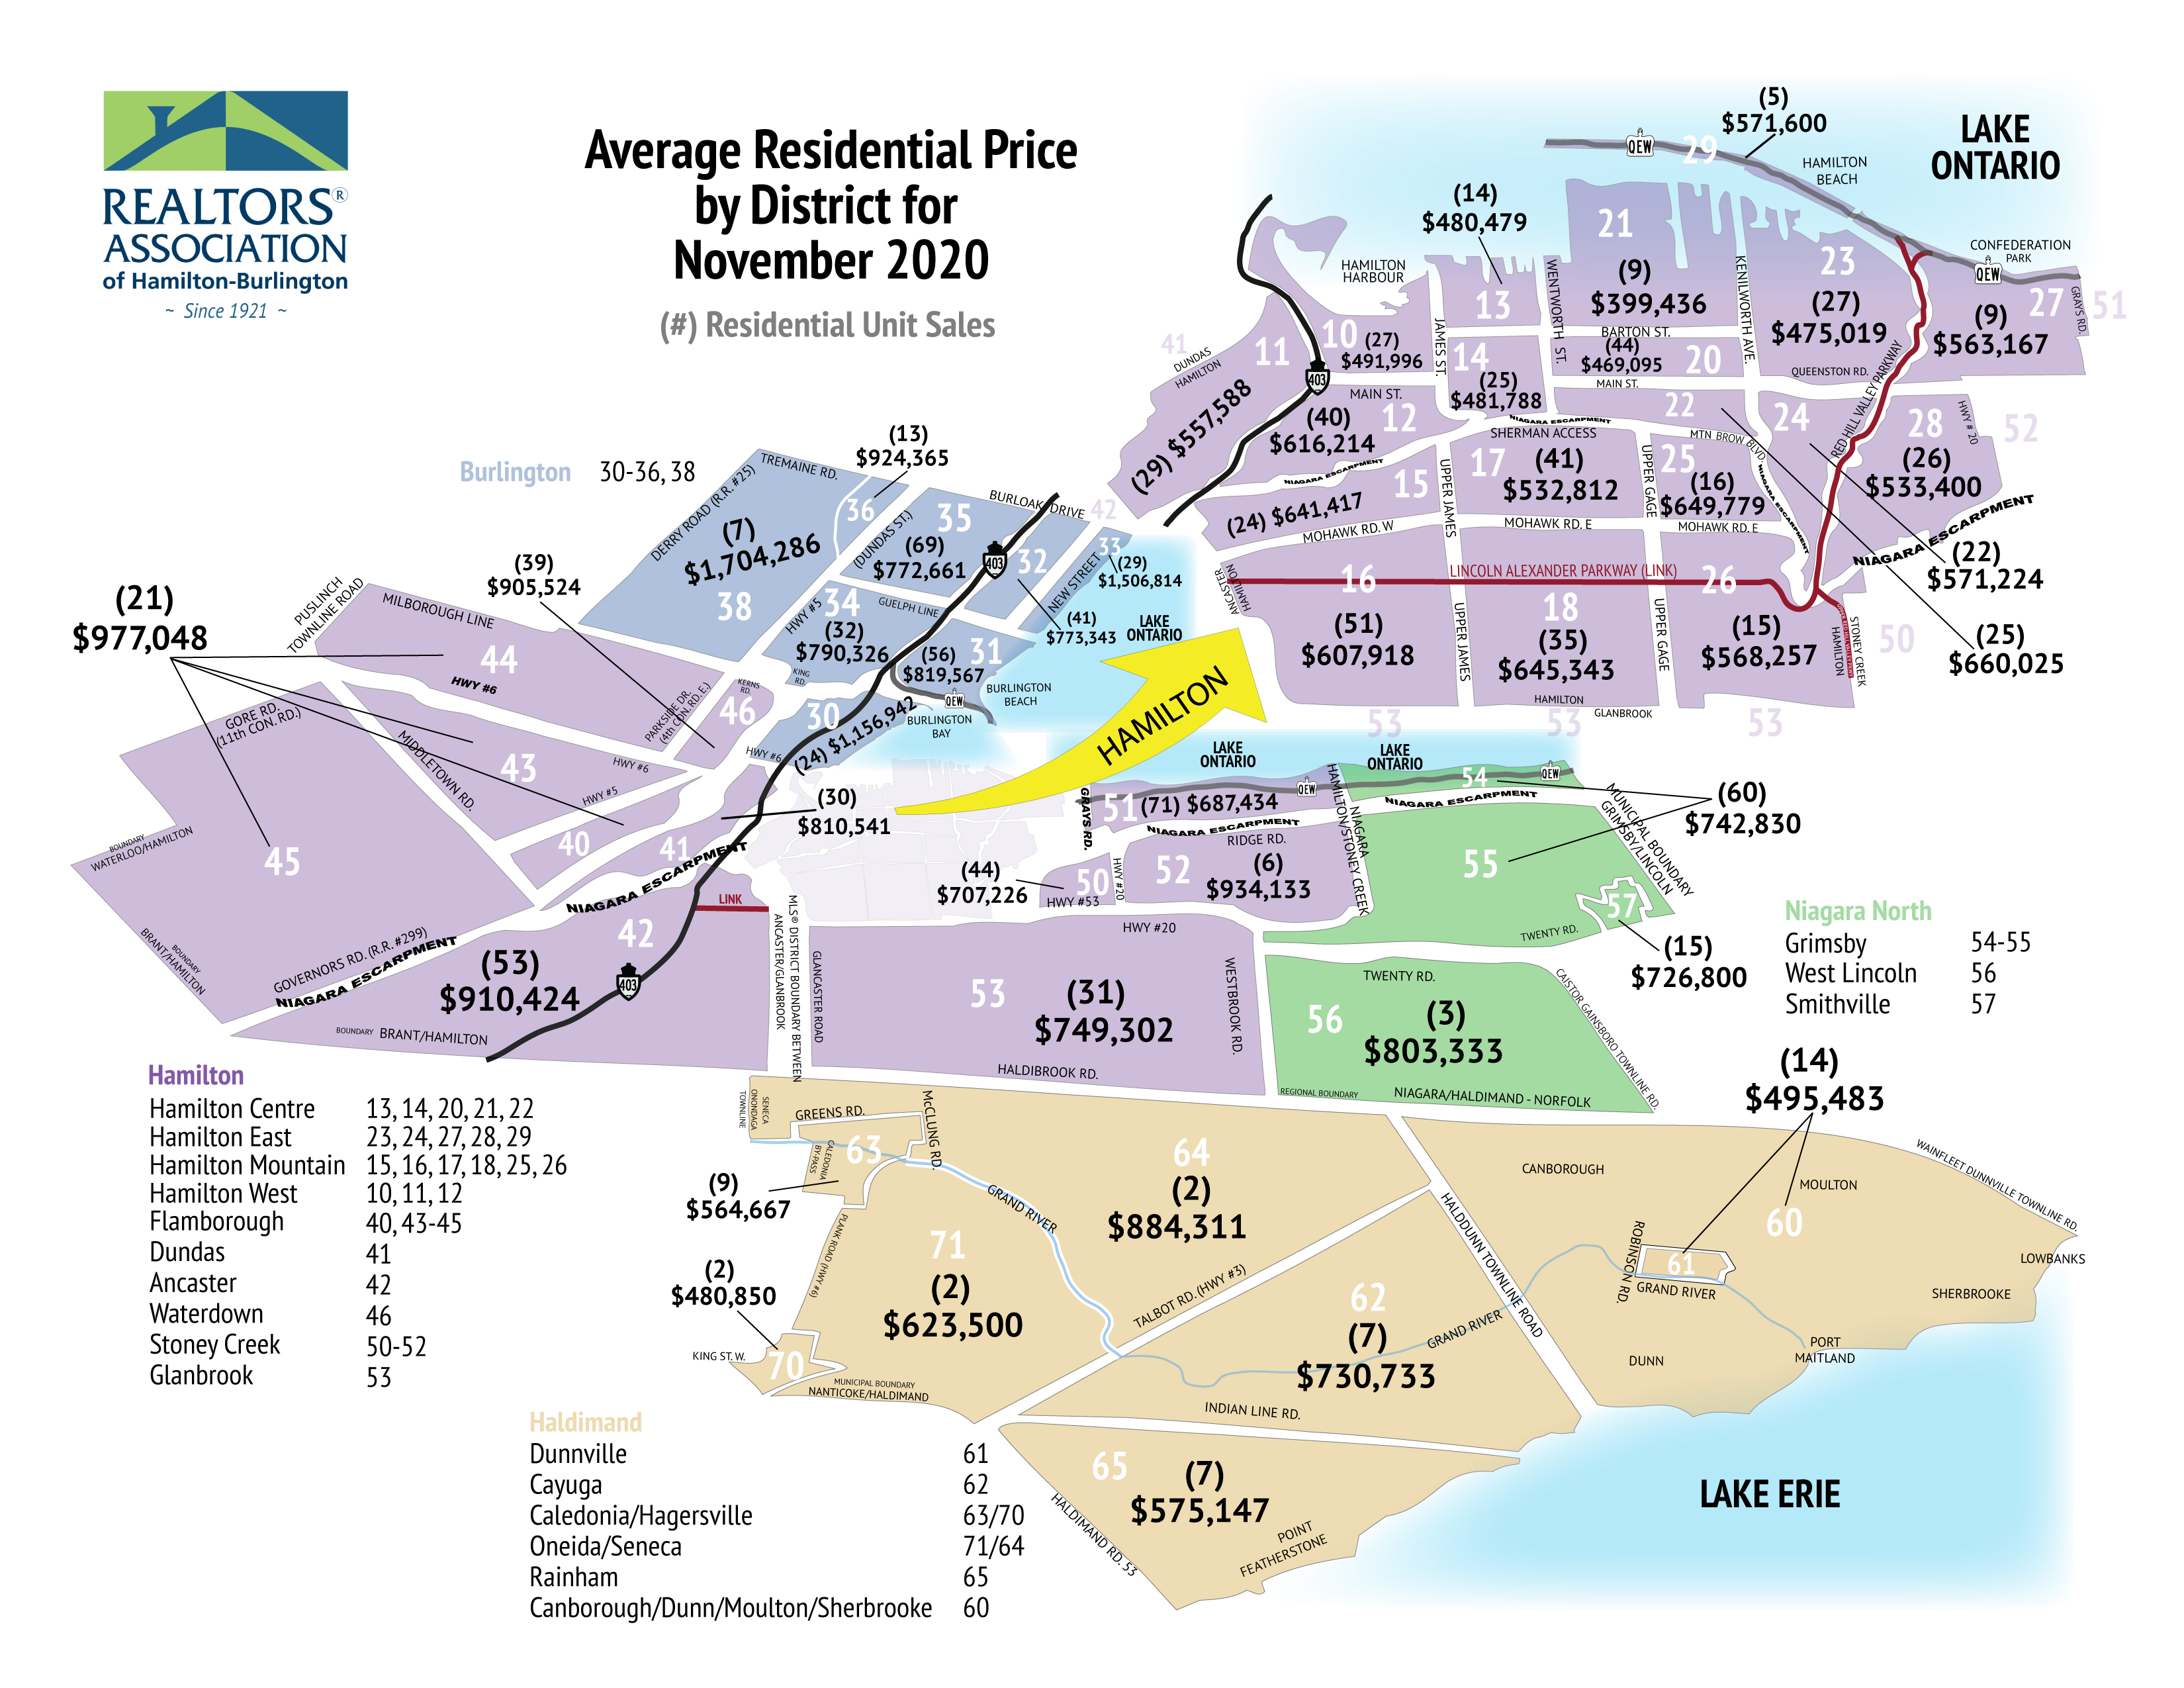
- Stats Map for Entire RAHB Area
- RAHB Commercial Activity
- Residential + Commercial Activity for RAHB Market Areas
- Historical Chart
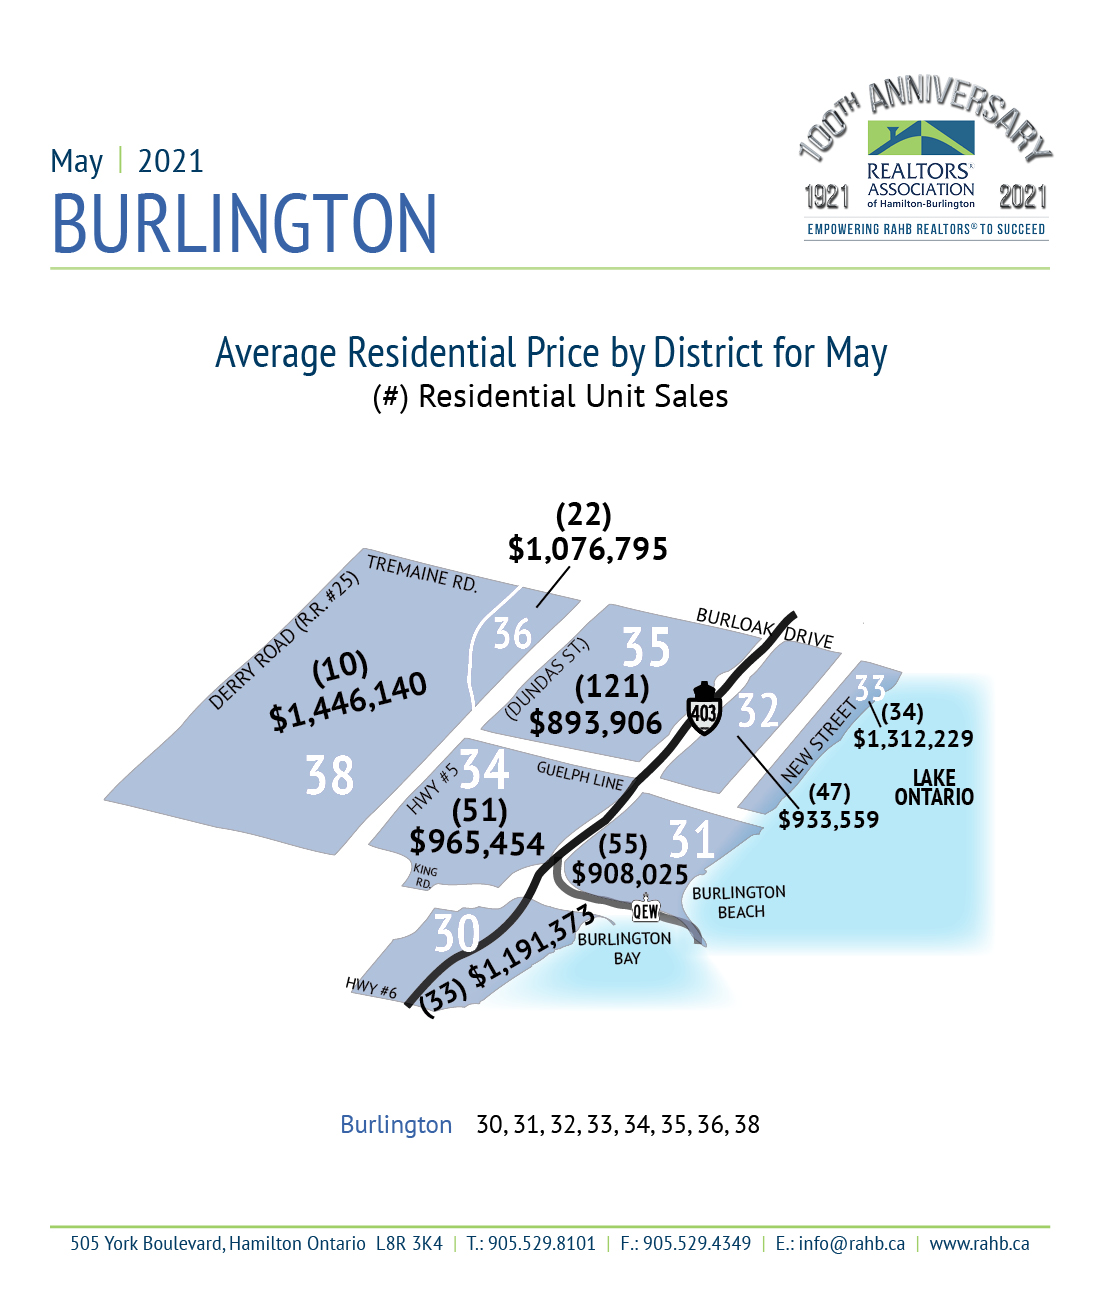
Burlington
- Residential Real Estate Market Activity Table for Burlington
- Burlington Market Activity and HPI Report (72 pages)
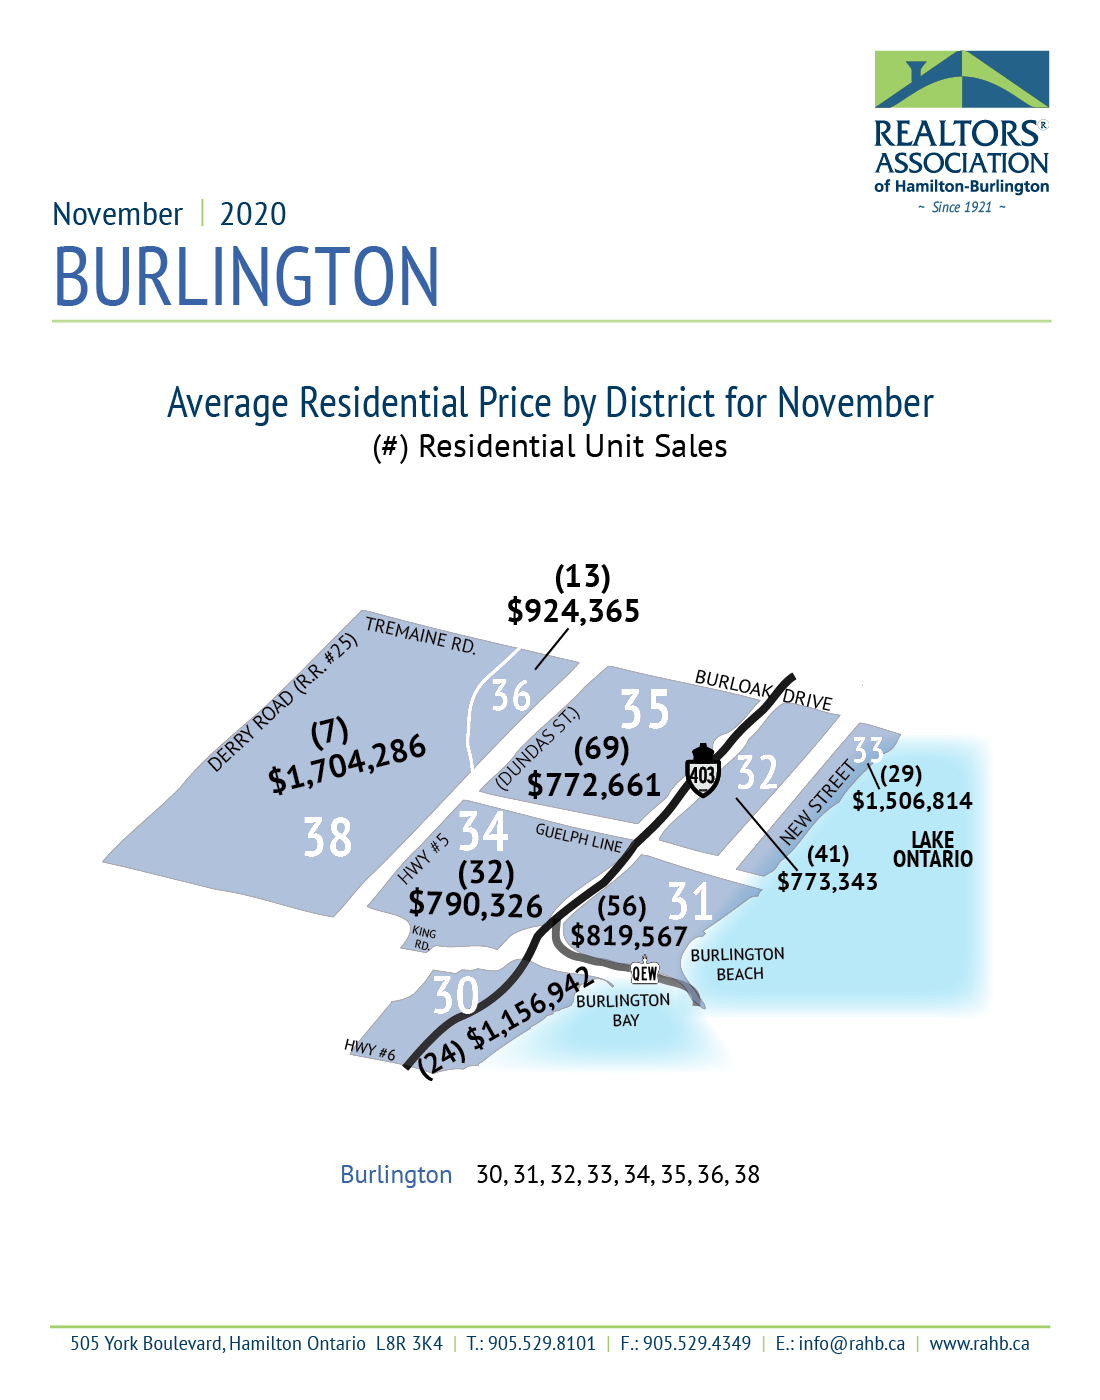
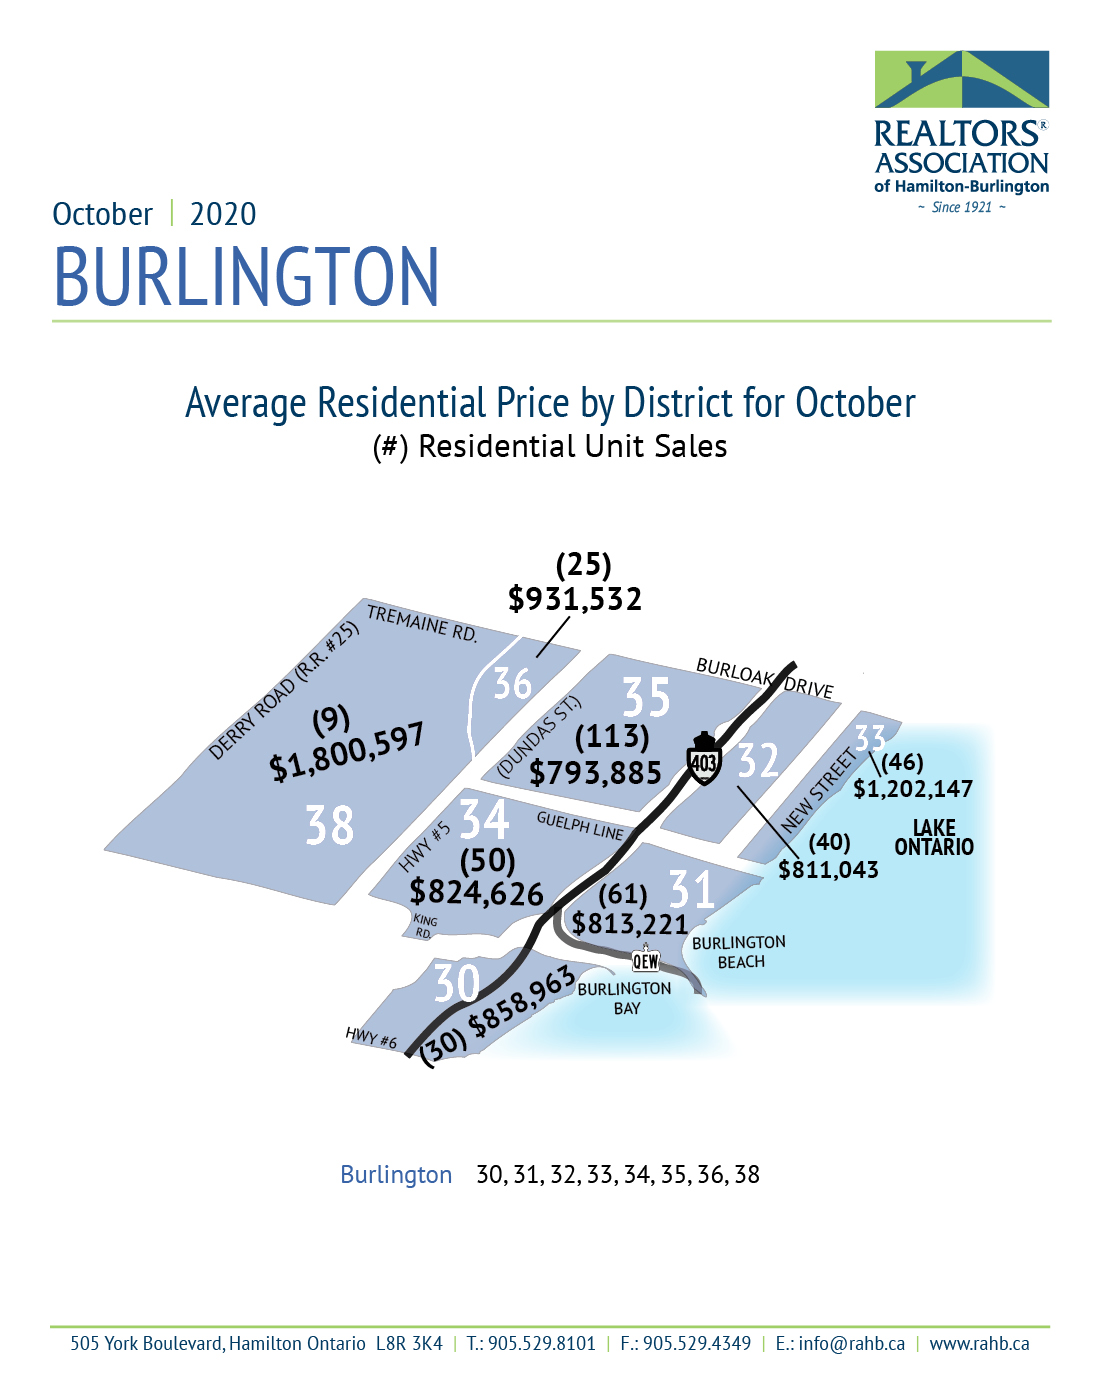
- Burlington Area Map
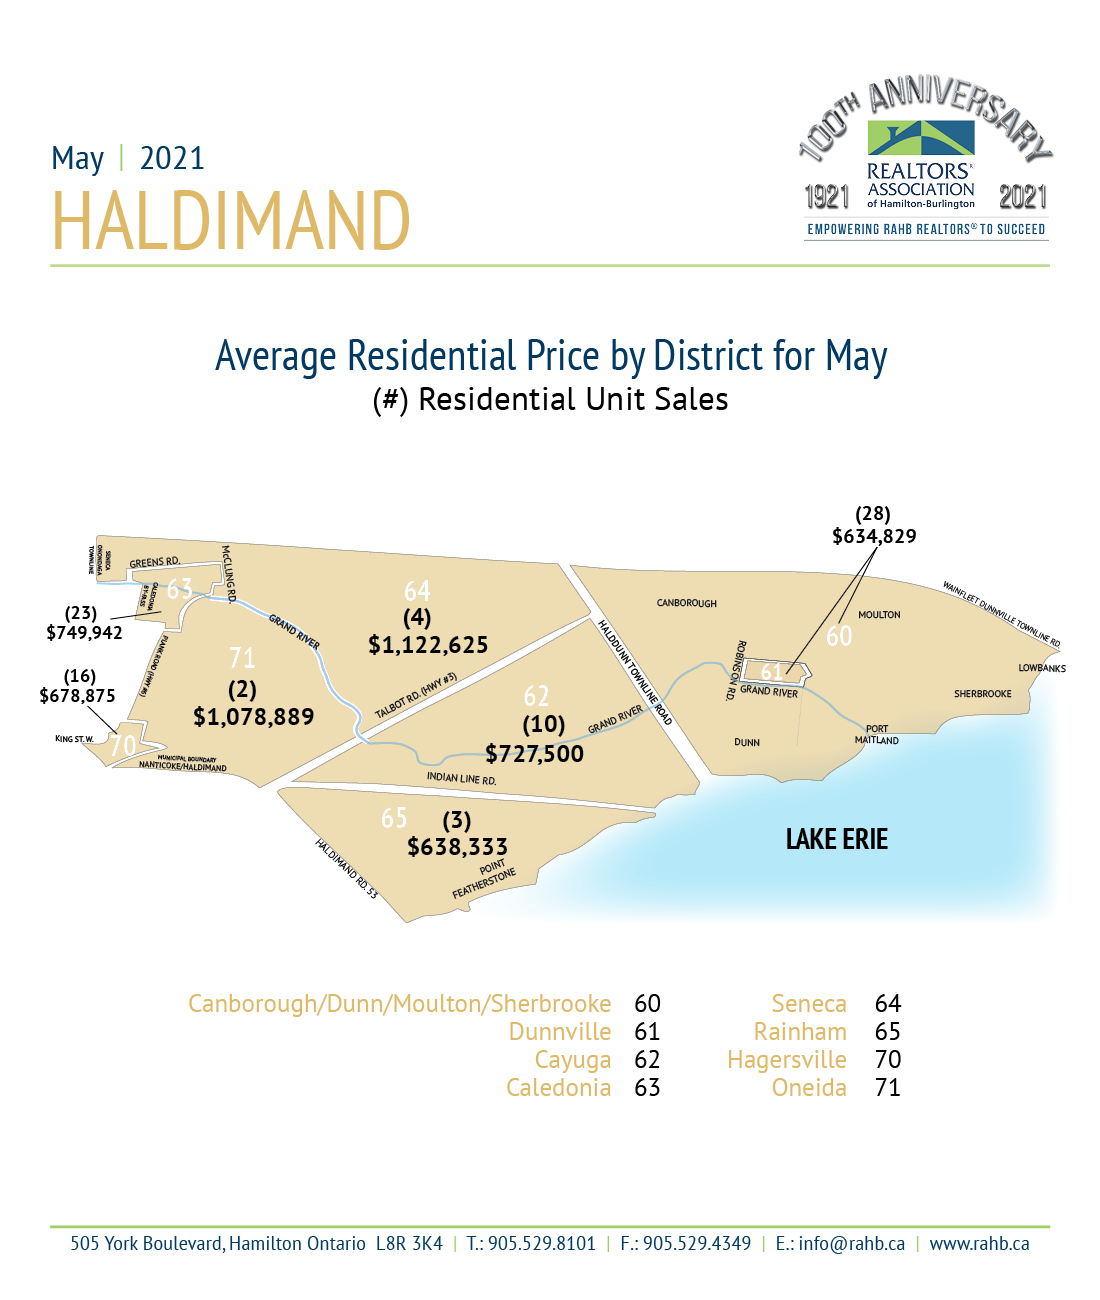
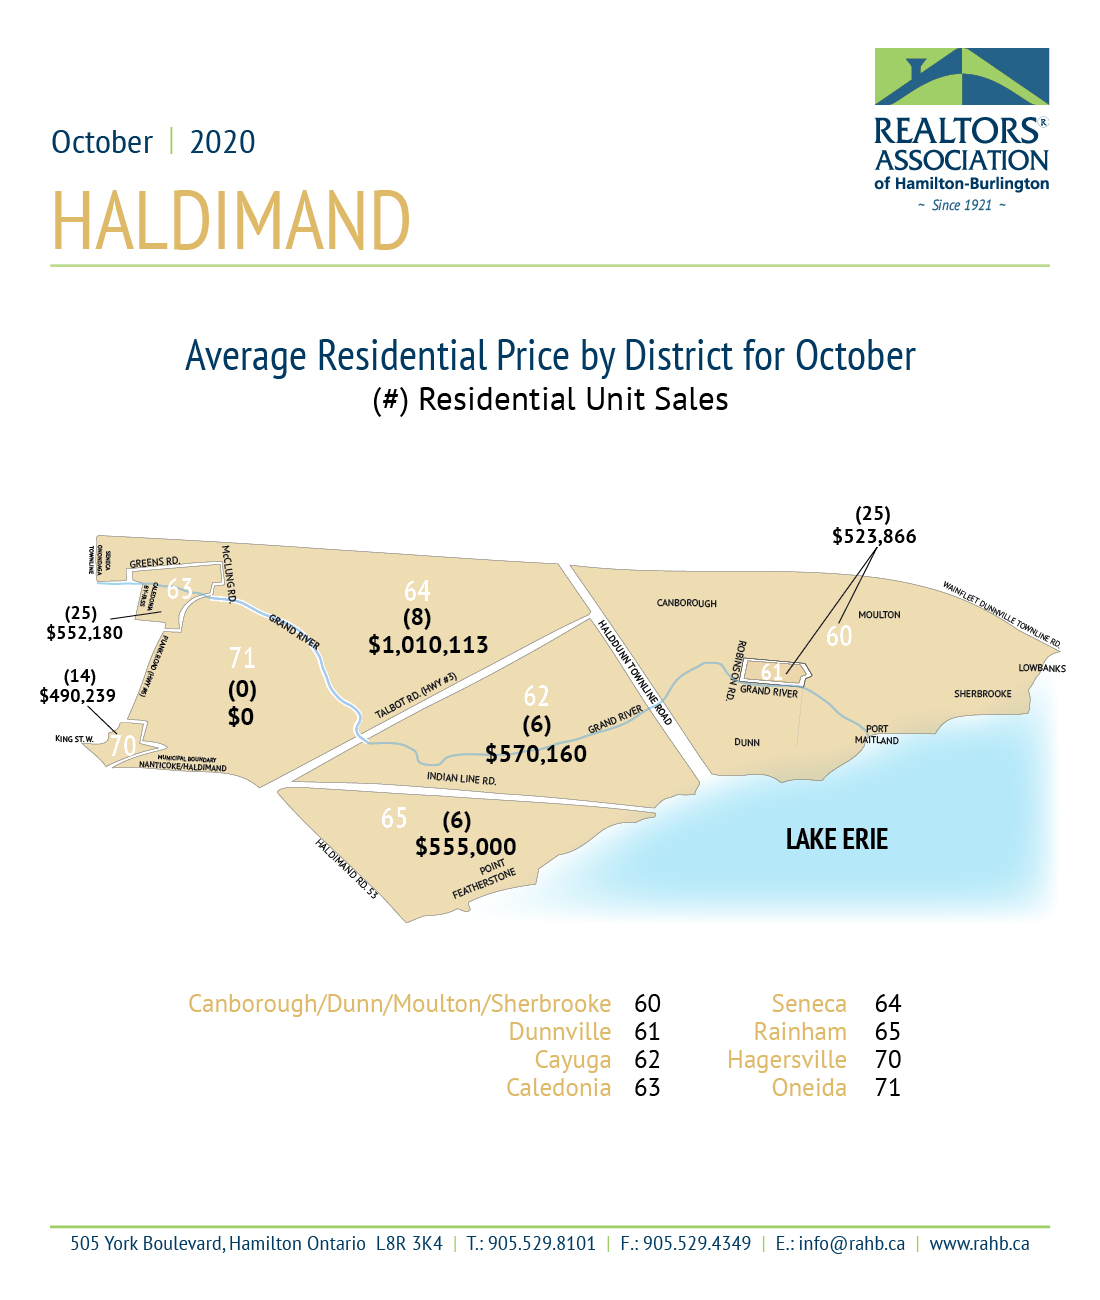
Haldimand
- Residential Real Estate Market Activity Table for Haldimand
- Haldimand Market Activity and HPI Report (58 pages)
- Haldimand Area Map
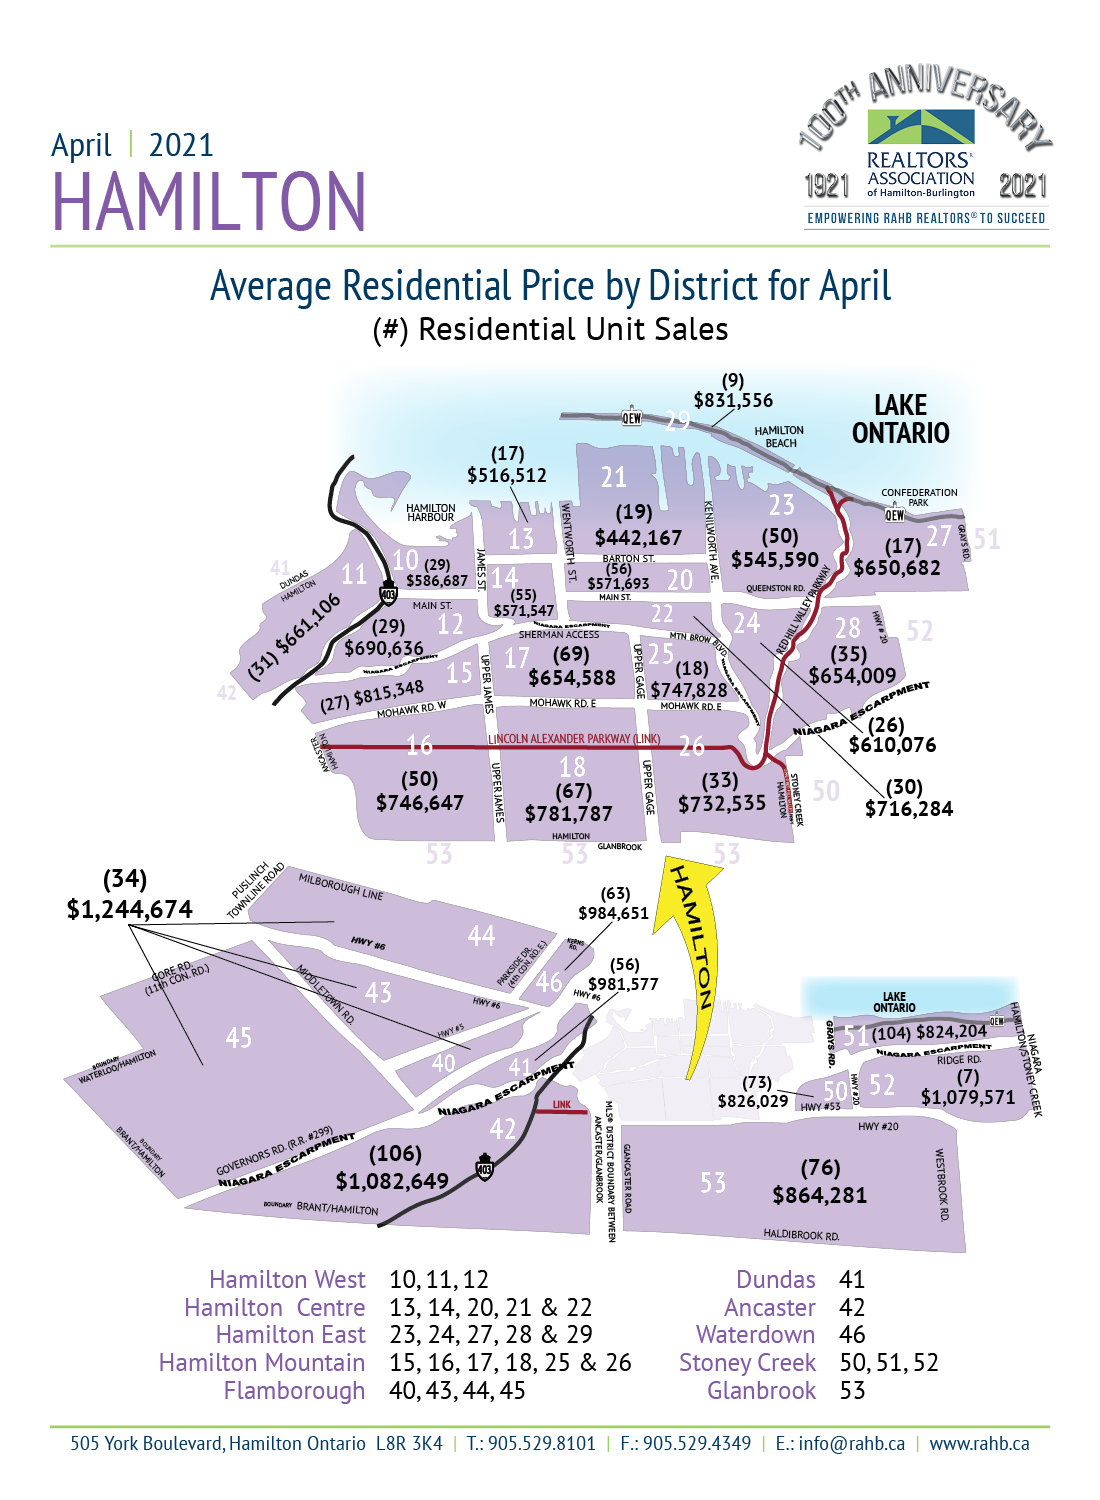
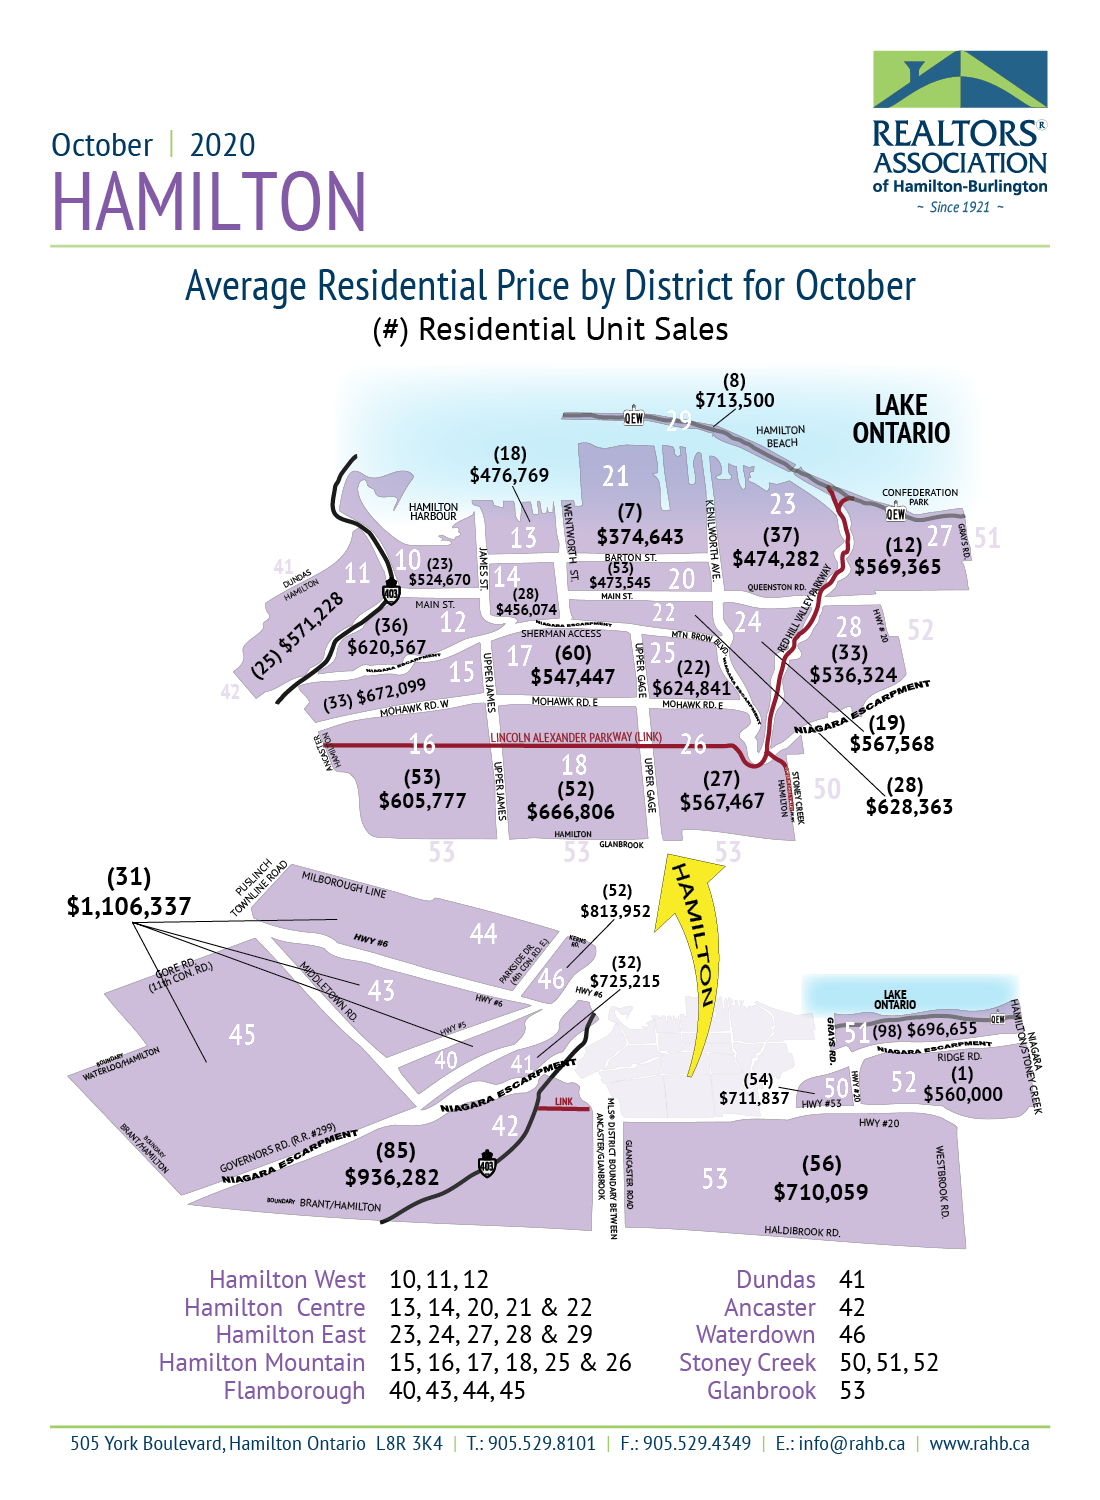
Hamilton
- Residential Real Estate Market Activity Table for Hamilton
- Hamilton Market Activity and HPI Report (197 pages)
- Hamilton Area Map
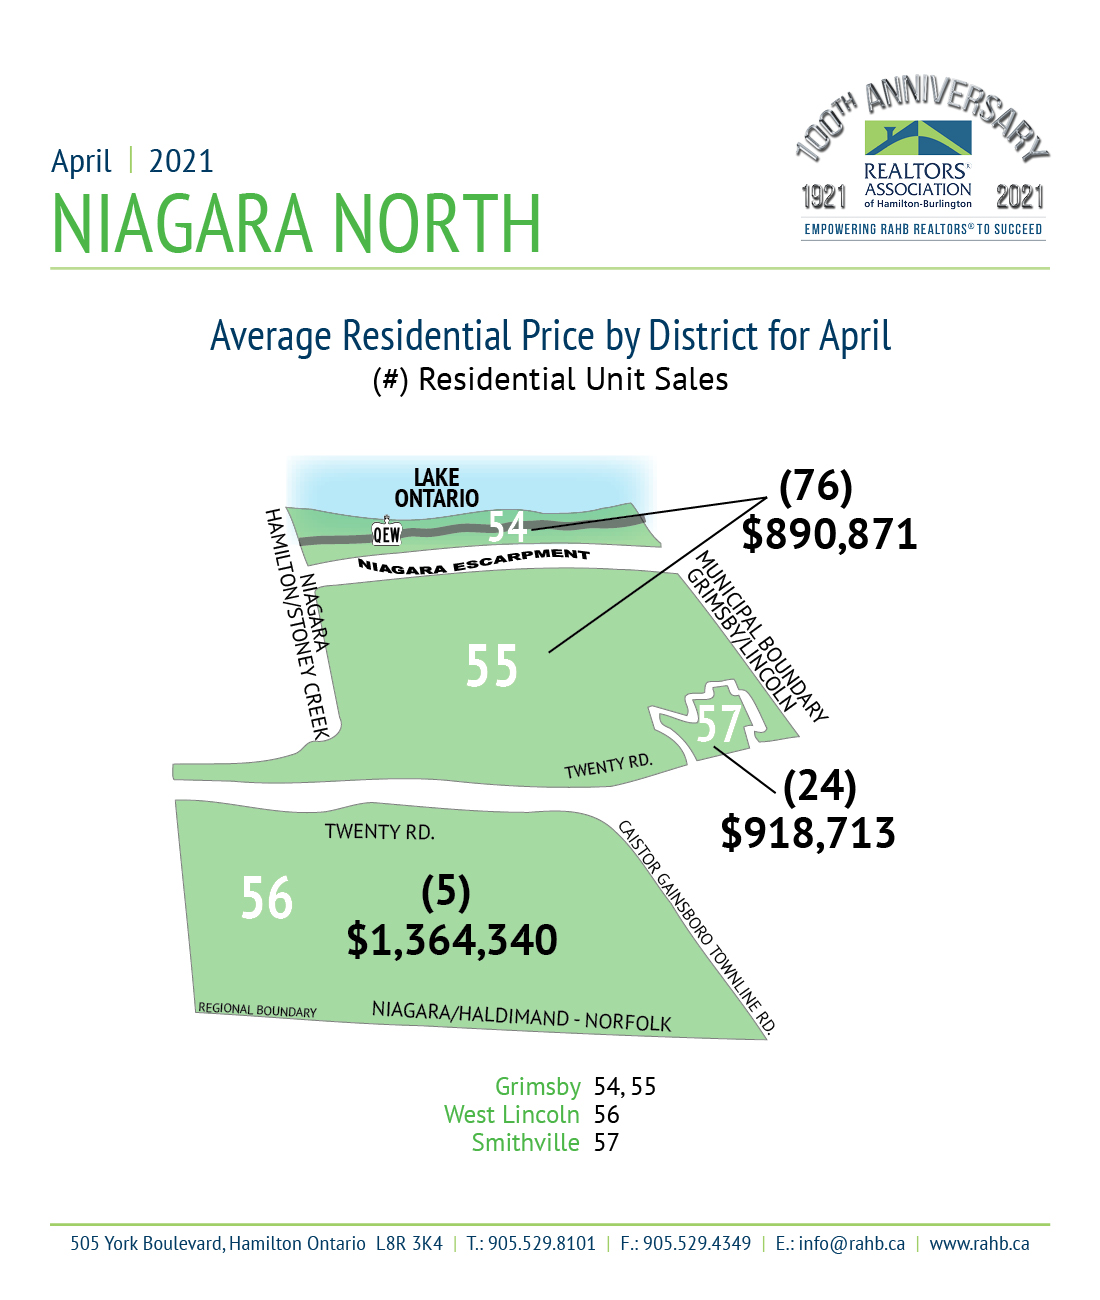
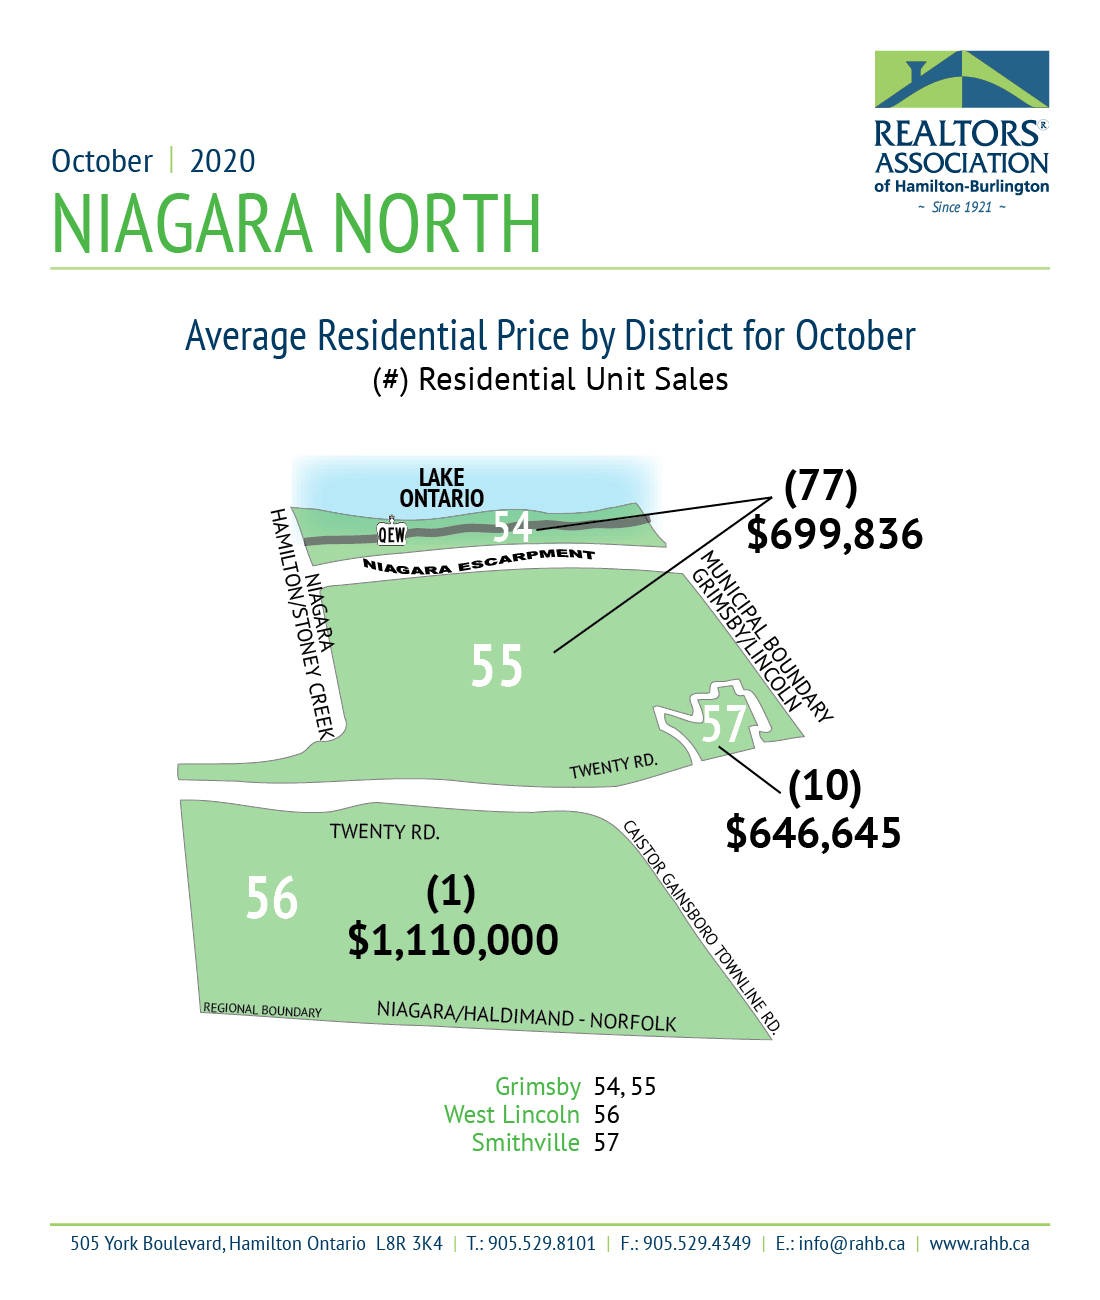
Niagara North


