Feb 5, 2015 | MLS®, Stats & Technology |
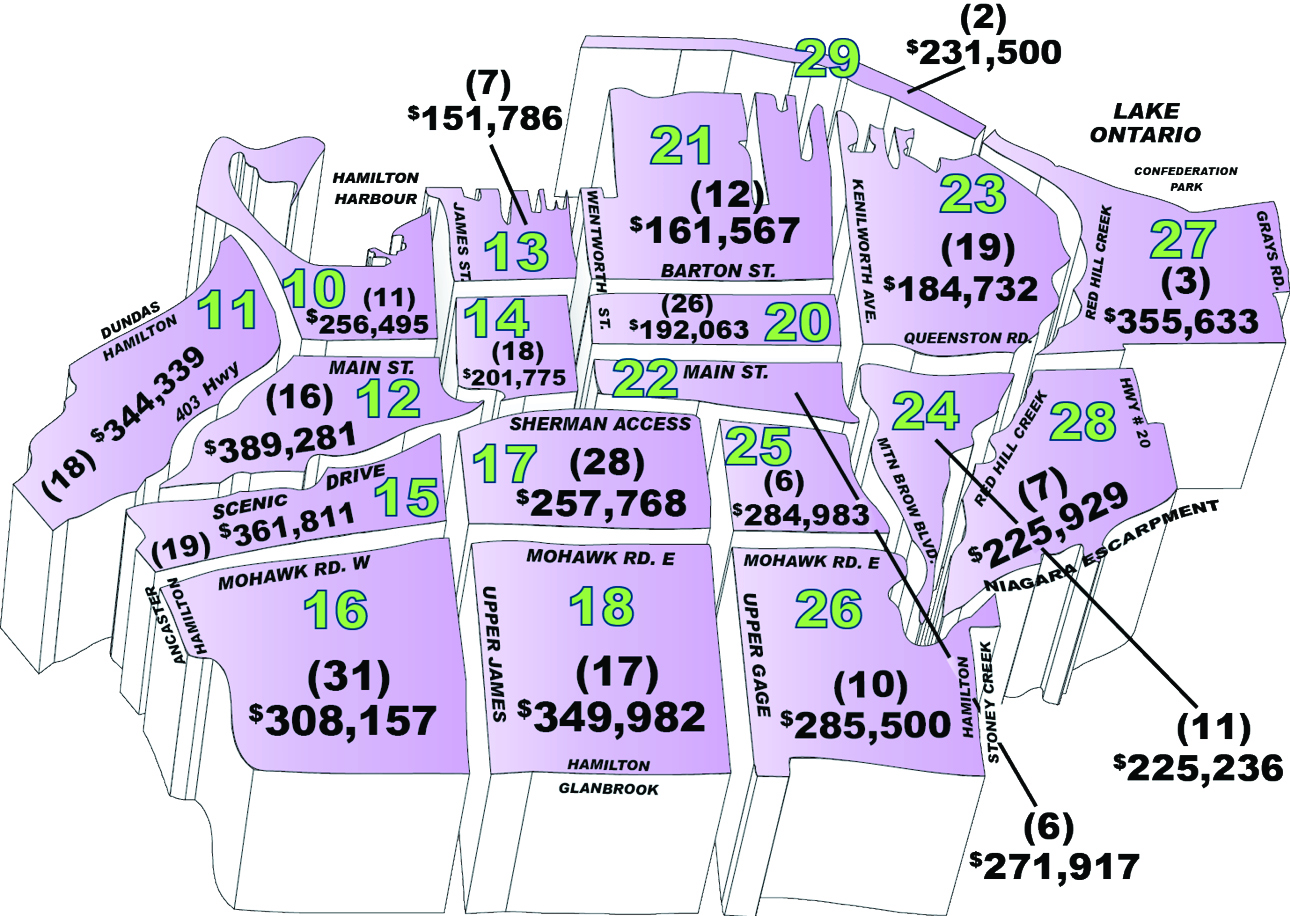
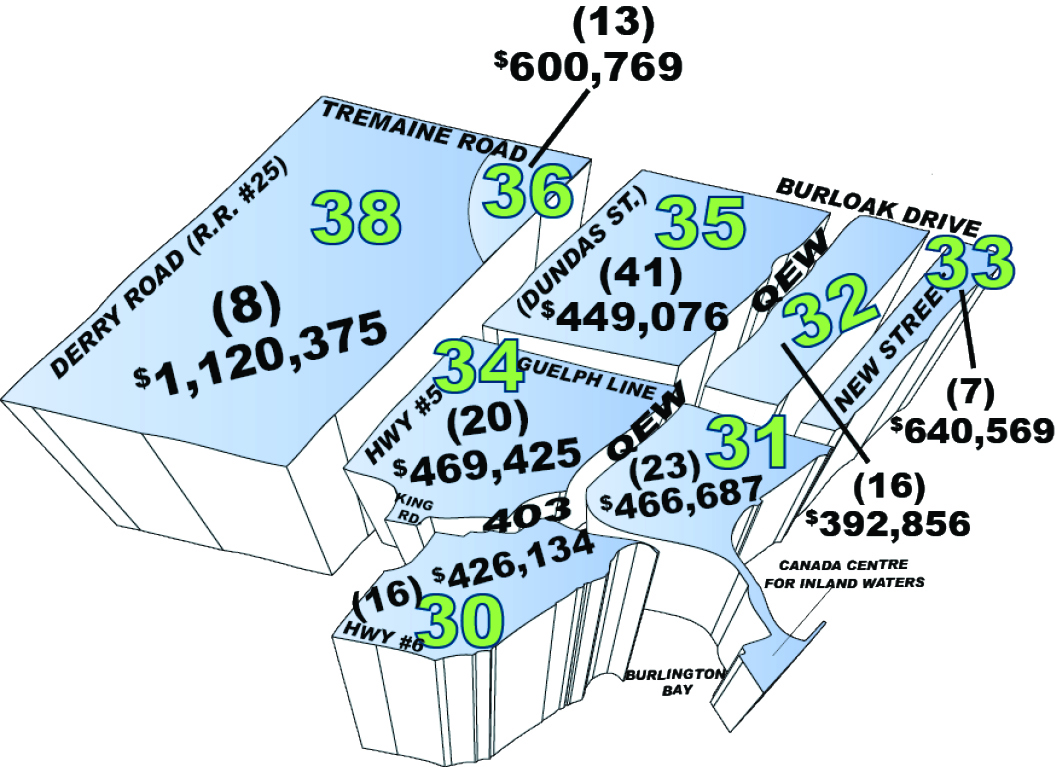
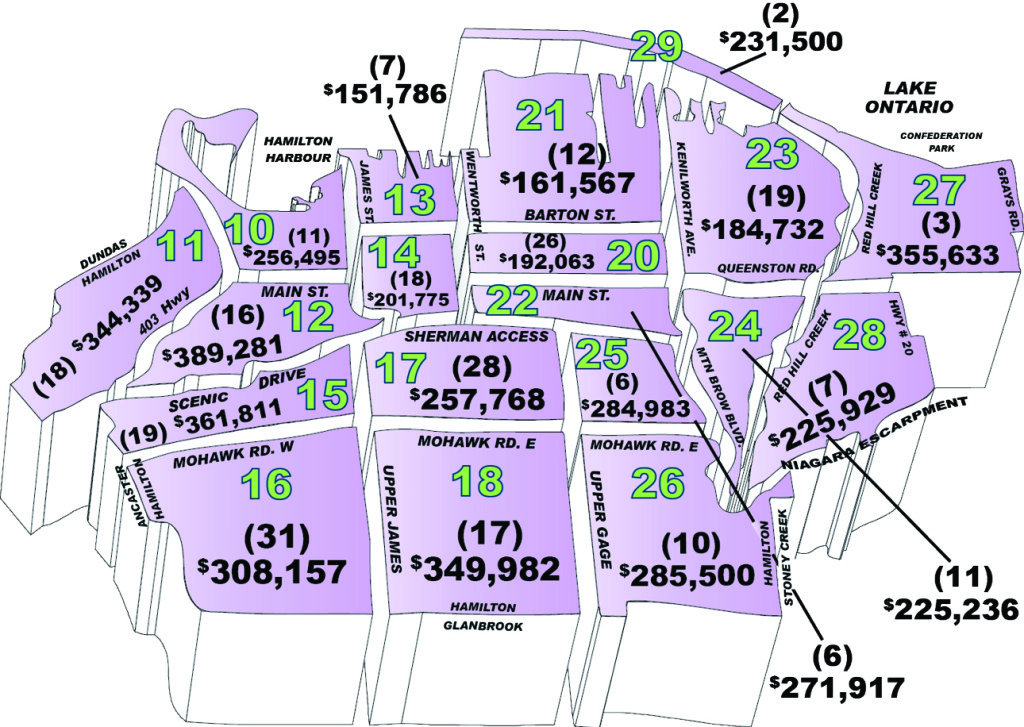
RAHB Average Price by District – (#) Residential Unit Sales
Hamilton
Hamilton West, 10 – 12
Hamilton East, 23, 24, 27 – 29
Hamilton Centre, 13, 14, 20 – 22
Hamilton Mountain, 15 – 18, 25 & 26

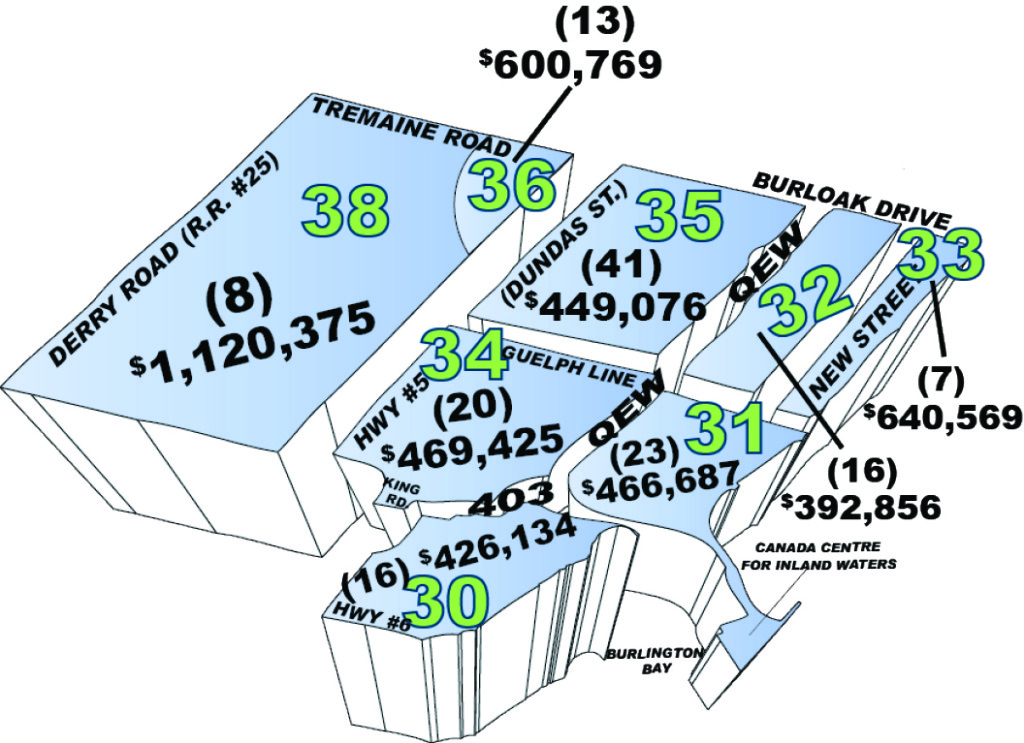
Burlington – 30 – 38

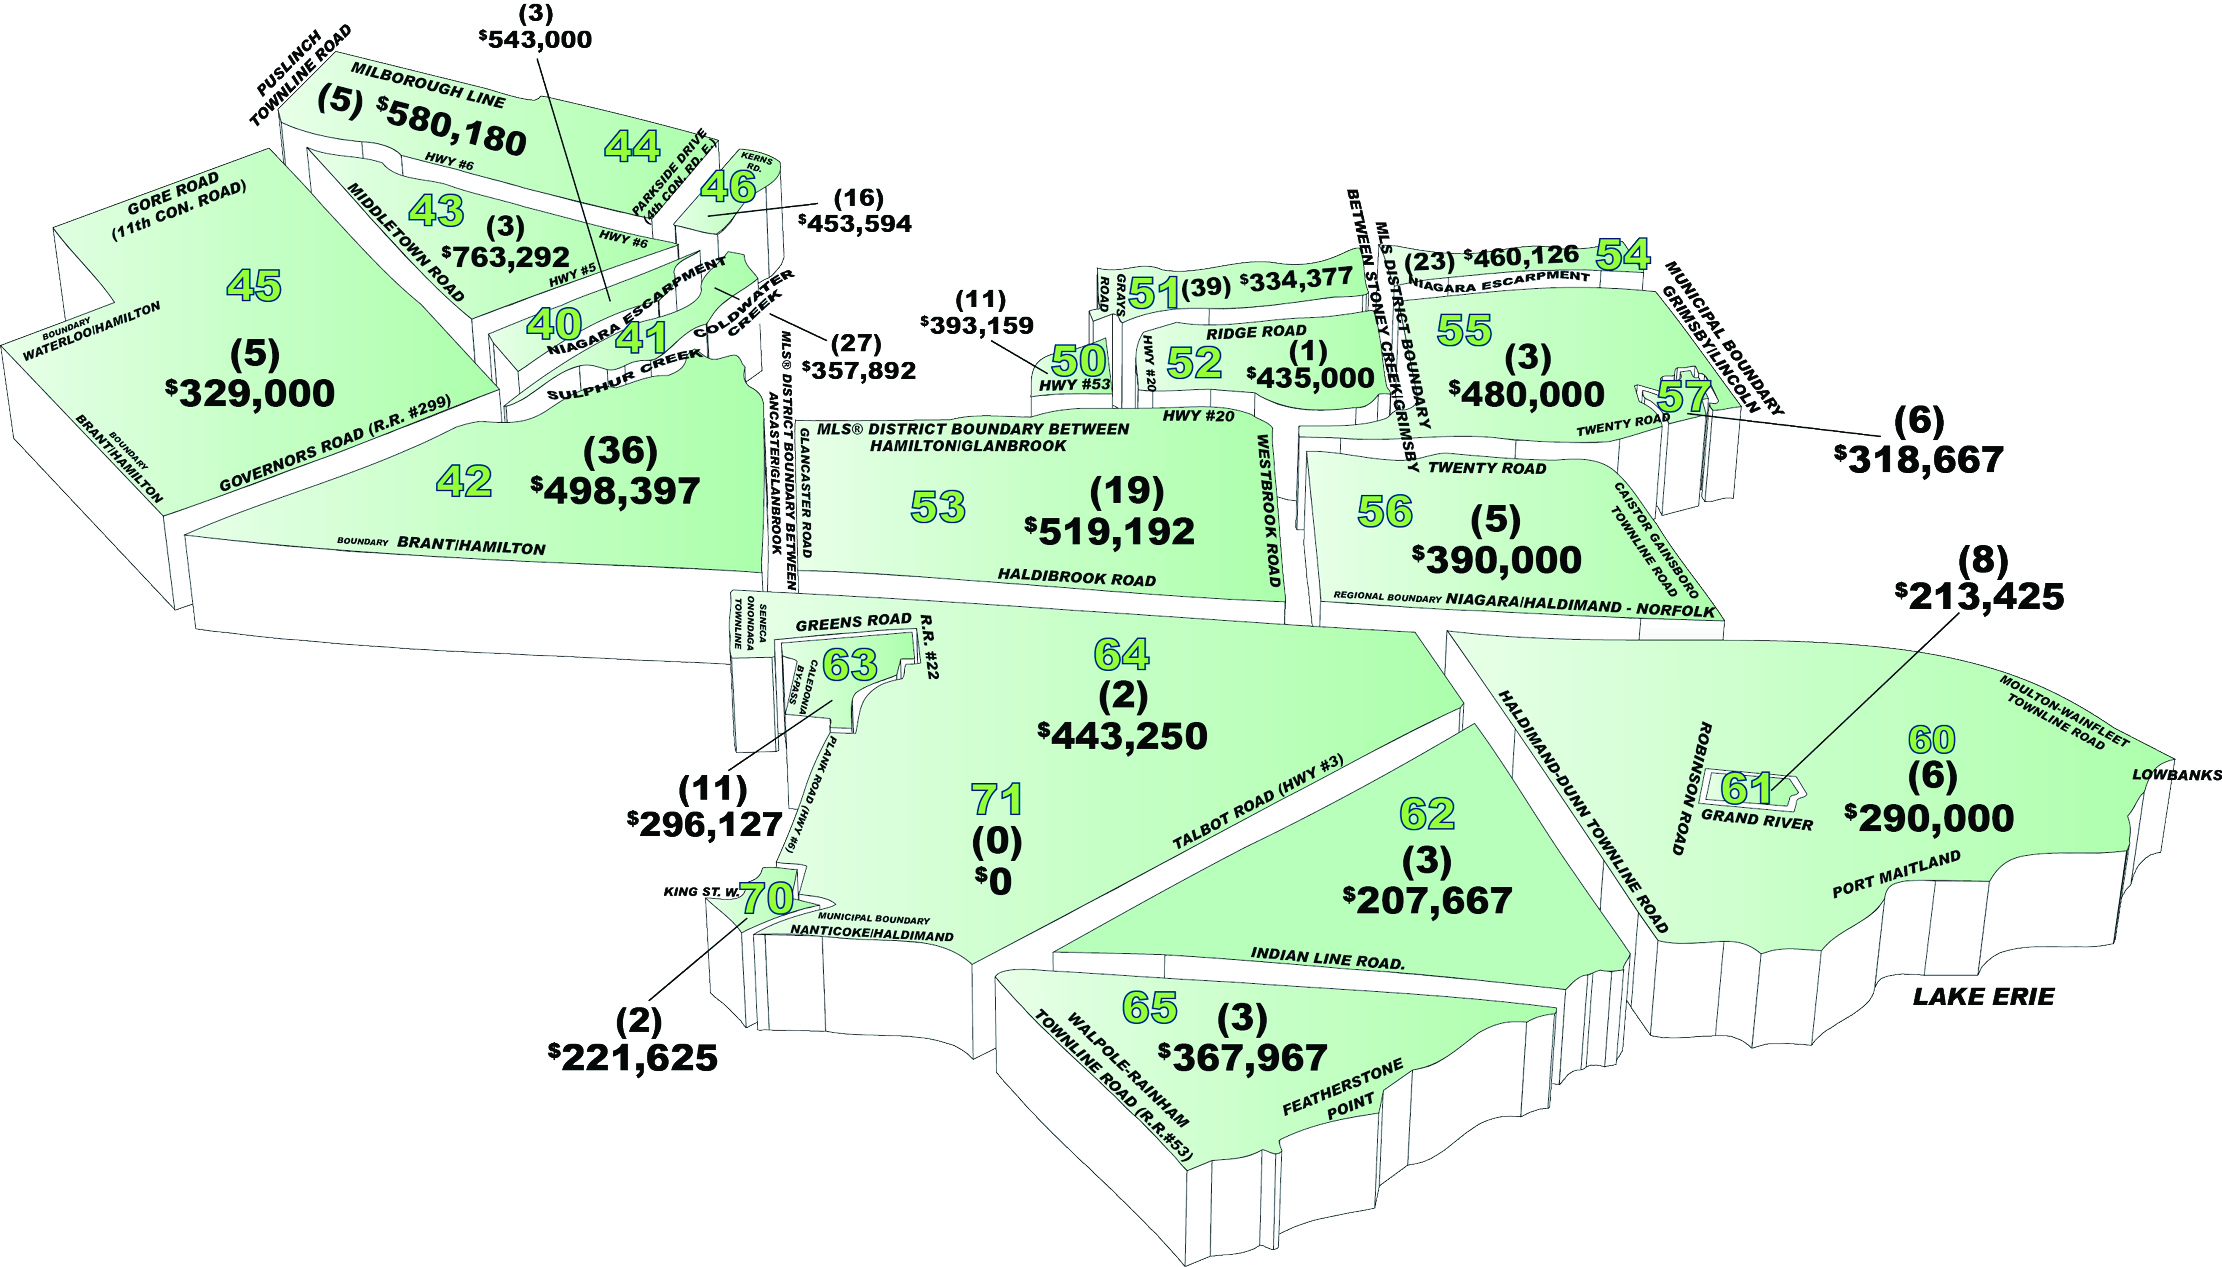
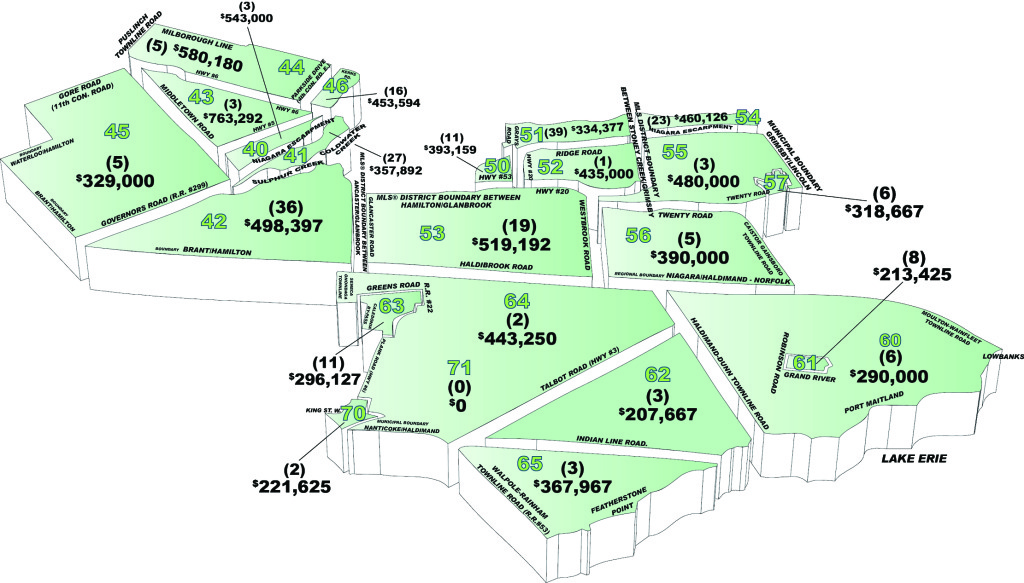
Outlying
Flamborough, 40, 43 – 45
Dundas, 41
Ancaster, 42
Waterdown, 46
Stoney Creek, 50 – 52
Glanbrook, 53
Grimsby, 54 -55
West Lincoln, 56
Smithville, 57
Dunnville, 61
Cayuga, 62
Calendonia/Hagersville, 63 & 70
Onieda/Seneca, 71 & 64
Rainham, 65
Canborough/Dunn, 60
Moulton/Sherbrooke, 60

Feb 3, 2015 | MLS®, Stats & Technology |
Watch your email for the monthly stats release and charts.
New for 2015 – the stats maps and pie charts will be included with your monthly stats email.
You can also find the RAHB stats on: www.rahb.ca, REALTOR Link®: Market Data & Stats, RAHB blog: https://blog.rahb.ca (use tags “stats” and “stats maps”.)
Jan 22, 2015 | MLS®, Stats & Technology |
Members are reminded that when they list a property located in the Niagara Association of REALTORS® jurisdiction, the square footage of the property is mandatory information and must be included on the listing, as per RAHB’s MLS® policies – Miscellaneous #22:
The following Joint MLS® Policy applies for both RAHB and the Niagara Association:
- When a member from either association places a listing which is located in the other association’s jurisdictional boundary, the member must adhere to that association’s rules and MLS® policies including all mandatory areas on the property information form (PIF). This means dependent on where the listing is located, all colour coded fields must be completed. Also other mandatory fields on the listing form which are coded … indicate, dependent on the association, what specific fields must be completed. Also any MLS® policies must be adhered to including the reporting of conditional and firm sales.
Jan 14, 2015 | MLS®, Stats & Technology |
Two new search fields have been added to the “Residential” search criteria under the “Add Fields” tab: “Total Bedrooms” and “Total Bathrooms”. Once you add them to your search criteria, it becomes easier to find properties with the total number of bedrooms and bathrooms you require, regardless of whether they are above or below grade or, in the case of bathrooms, full baths or half-baths.
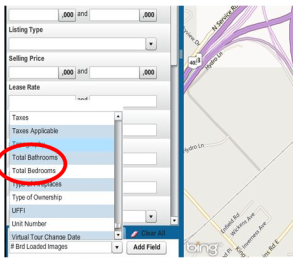
Here’s how the new fields work:
“Total Bathrooms” – When you search for a home with, for example, two bathrooms – either full baths or a combination of full and half baths – you can add this field and enter a value of “2” in the new “Total Bathrooms” field. The search will return all the residential properties with two or more bathrooms, regardless if there are two full baths or one full bath and one half bath.
“Total Bedrooms” – When you search for a home with, say, three bedrooms and you don’t care if they are above or below grade, you can add this new field. It will add the number of bedrooms and number of additional bedrooms to give you a result. (Previously you could use only the “Bedrooms” field, which only counted the bedrooms above grade.)
Jan 9, 2015 | MLS®, Stats & Technology |
RAHB Average Price by District – (#) Residential Unit Sales
Hamilton
Hamilton West, 10 – 12
Hamilton East, 23, 24, 27 – 29
Hamilton Centre, 13, 14, 20 – 22
Hamilton Mountain, 15 – 18, 25 & 26
Burlington – 30 36, 38
Outlying
Flamborough, 40, 43 – 45
Dundas, 41
Ancaster, 42
Waterdown, 46
Stoney Creek, 50 – 52
Glanbrook, 53
Grimsby, 54 -55
West Lincoln, 56
Smithville, 57
Dunnville, 61
Cayuga, 62
Calendonia/Hagersville, 63 & 70
Onieda/Seneca, 71 & 64
Rainham, 65
Canborough/Dunn, 60
Moulton/Sherbrooke, 60
Jan 9, 2015 | MLS®, Stats & Technology |


Jan 9, 2015 | MLS®, Stats & Technology |
The REALTORS® Association of Hamilton-Burlington (RAHB) reported 796 property sales processed through the RAHB Multiple Listing Service® (MLS®) system in December. This represents a 7.6 per cent increase in sales compared to December of the previous year.
There were 695 properties listed in December, an increase of 15.4 per cent compared to the same month the year prior. End-of-month listing inventory was 13 per cent lower.
“We saw a very strong real estate market in December,” said RAHB President Donna Bacher. “Listings and sales were both above average for the month; we haven’t seen a December market like this since 2009.”
Seasonally adjusted* sales of residential properties were 4.4 per cent higher than the same month of the previous year, with the average sale price up 4.5 per cent for the month. Seasonally adjusted numbers of new listings were 11.3 per cent higher than the same month the year prior.
Seasonally adjusted data for residential properties for the month of December, 2014:

Actual overall residential sales were 8.2 per cent higher than the previous year at the same time. Residential freehold sales were 9.8 per cent higher while sales in the condominium market saw an increase of 2.1 per cent.
“With more properties selling than were listed in December, we may be in for an interesting January,” added Bacher. “Statistically speaking, we’ve now sold some of the listing inventory, leaving us with considerably fewer listings going into the new year. The low inventory and December’s strong sales mean we remain in a seller’s market.”
The average price of freehold properties showed an increase of 5.4 per cent compared to the same month the previous year; the average sale price in the condominium market decreased by 2.2 per cent when compared to the same period.
The average sale price is based on the total dollar volume of all properties sold in the RAHB market area. Average sale price information can be useful in establishing long term trends, but should not be used as an indicator that specific properties have increased or decreased in value.
The average days on the market decreased from 51 to 45 days in the freehold market and increased from 47 to 53 days in the condominium market when compared to the same month the previous year.

Every community in RAHB’s market area has its own localized residential market. Please refer to the accompanying chart for residential market activity in select areas in RAHB’s jurisdiction.

*Seasonal adjustment removes normal seasonal variations, enabling analysis of monthly changes and fundamental trends in the data.
Dec 5, 2014 | MLS®, Stats & Technology |


Dec 5, 2014 | MLS®, Stats & Technology |
Average price by district for Outlying, Hamilton and Burlington RAHB jurisdictional areas for November 2014. (#) Residential Unit Sales.


Dec 5, 2014 | MLS®, Stats & Technology |
The REALTORS® Association of Hamilton-Burlington (RAHB) reported 1096 property sales processed through the RAHB Multiple Listing Service® (MLS®) system in November. This represents a 1.8 per cent increase in sales compared to November of last year.
There were 1287 properties listed in November, a decrease of 2.1 per cent compared to the same month last year. End-of-month listing inventory was 12.9 per cent lower than last year at the same time.
“It’s still a seller’s market in our market area,” said RAHB CEO Ross Godsoe. “Listings were lower compared to the same month last year and were a little over six per cent lower than the 10-year average for the month, while sales were up compared to last year and about 8.5 per cent higher than average for a November.”
Seasonally adjusted* sales of residential properties were 5.2 per cent higher than the same month last year, with the average sale price up 8.5 per cent for the month. Seasonally adjusted numbers of new listings were 2.2 per cent higher than the same month last year.
Seasonally adjusted data for residential properties for the month of November, 2014:

Actual overall residential sales were 2.9 per cent higher than the previous year at the same time. Residential freehold sales were 3.4 per cent higher than last year while sales in the condominium market saw an increase of one per cent.
“November’s residential sales were the second highest in ten years for the month,” added Godsoe.
The average price of freehold properties showed an increase of 6.4 per cent compared to the same month last year; the average sale price in the condominium market increased 17 per cent when compared to the same period last year.
The average sale price is based on the total dollar volume of all properties sold in the RAHB market area. Average sale price information can be useful in establishing long term trends, but should not be used as an indicator that specific properties have increased or decreased in value.
The average days on the market decreased from 46 to 40 days in the freehold market and decreased from 49 to 39 days in the condominium market when compared to the same month last year.
Year to date, listings are two per cent higher than the same January-to-November period a year ago. Sales are 5.8 per cent higher and the average sale price is 5.8 per cent higher for the period.

Every community in RAHB’s market area has its own localized residential market. Please refer to the accompanying chart for residential market activity in select areas in RAHB’s jurisdiction.

*Seasonal adjustment removes normal seasonal variations, enabling analysis of monthly changes and fundamental trends in the data.
Dec 5, 2014 | MLS®, Stats & Technology |
New fees for TREB interboards
Effective January 1, 2015 a fee of $20 plus applicable taxes will be charged for any request of TREB staff to change, re-arrange or delete photographs on active listings.
Nov 12, 2014 | MLS®, Stats & Technology |
Property Panorama just got better!
Property Panorama has released an upgrade to their Virtual Tours application which will automatically create virtual tours for you. (more…)