The REALTORS® Association of Hamilton-Burlington (RAHB) reported 1,145 sales of residential properties located within the RAHB market area were processed through the Multiple Listing Service® (MLS®) System in October 2019. October sales are up from September and August, as well as up from October 2018 by 6.4 per cent. The average price for residential properties increased by 7.1 per cent from October 2018 to $602,029.
Follow the links below for:
- Residential Market Activity for RAHB Area
- All RAHB Residential Market Activity and HPI Report (17 pages)
- RAHB Residential Market at a Glance
- Social Media Stats Kit
- Stats Map for Entire RAHB Area
- RAHB Commercial Activity
- Residential + Commercial Activity for RAHB Market Areas
- Historical Chart
Burlington
- Residential Real Estate Market Activity Table for Burlington
- Burlington Market Activity and HPI Report (72 pages)
- Burlington Area Map
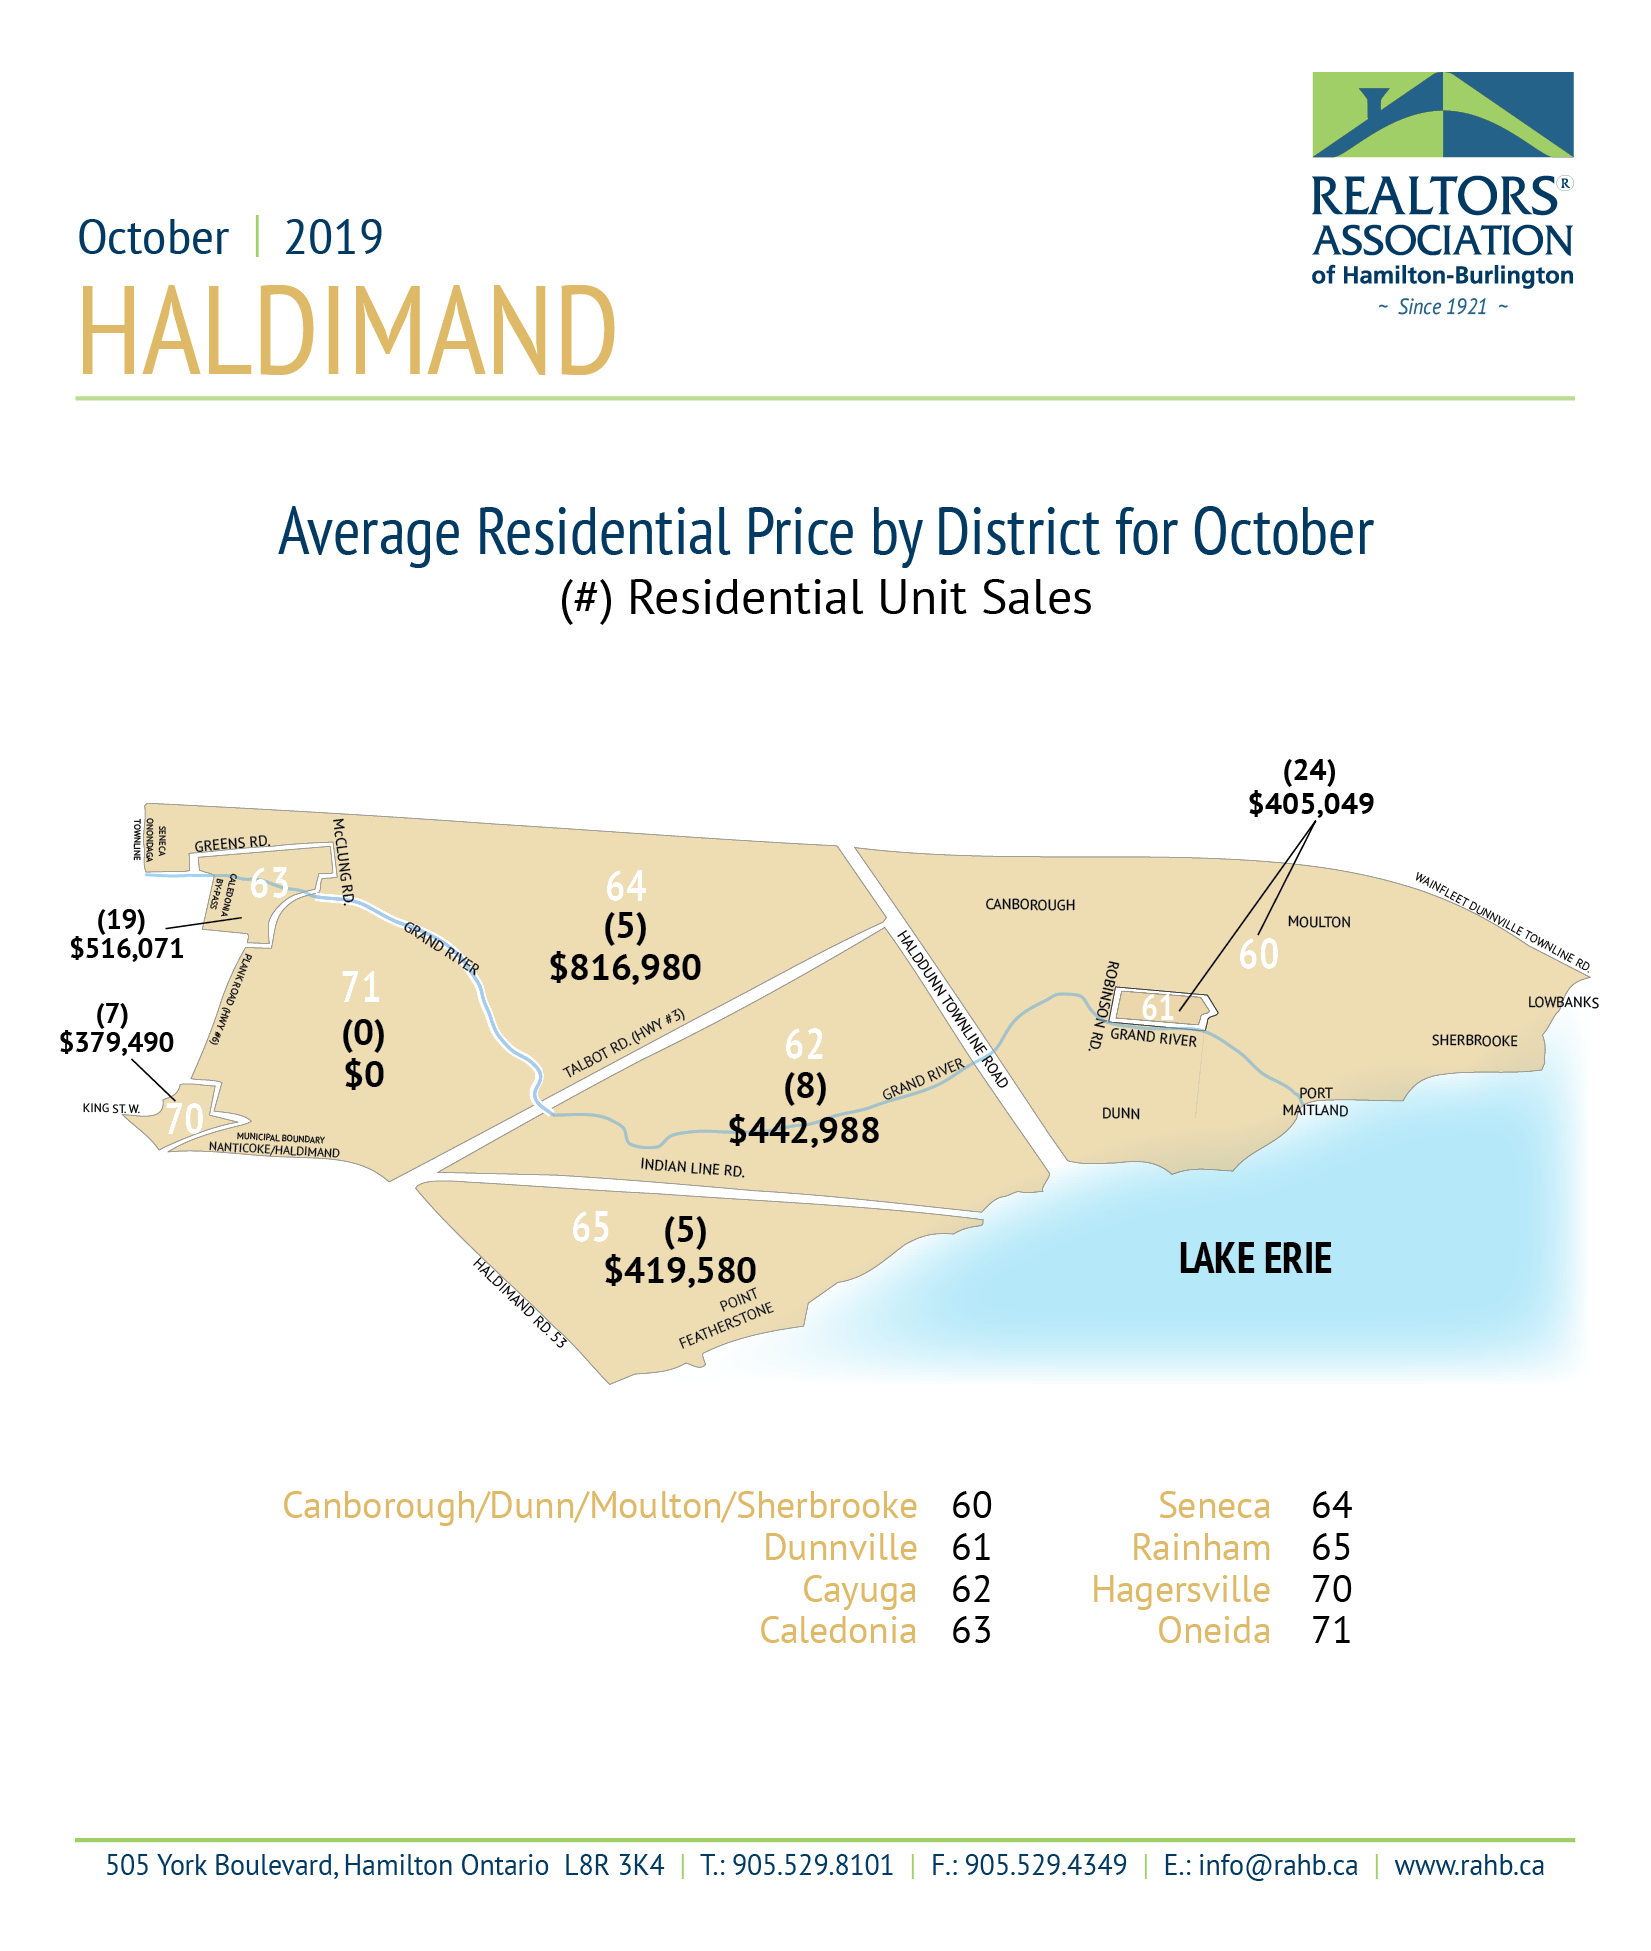
Halidmand
- Residential Real Estate Market Activity Table for Haldimand
- Haldimand Market Activity and HPI Report (58 pages)
- Haldimand Area Map
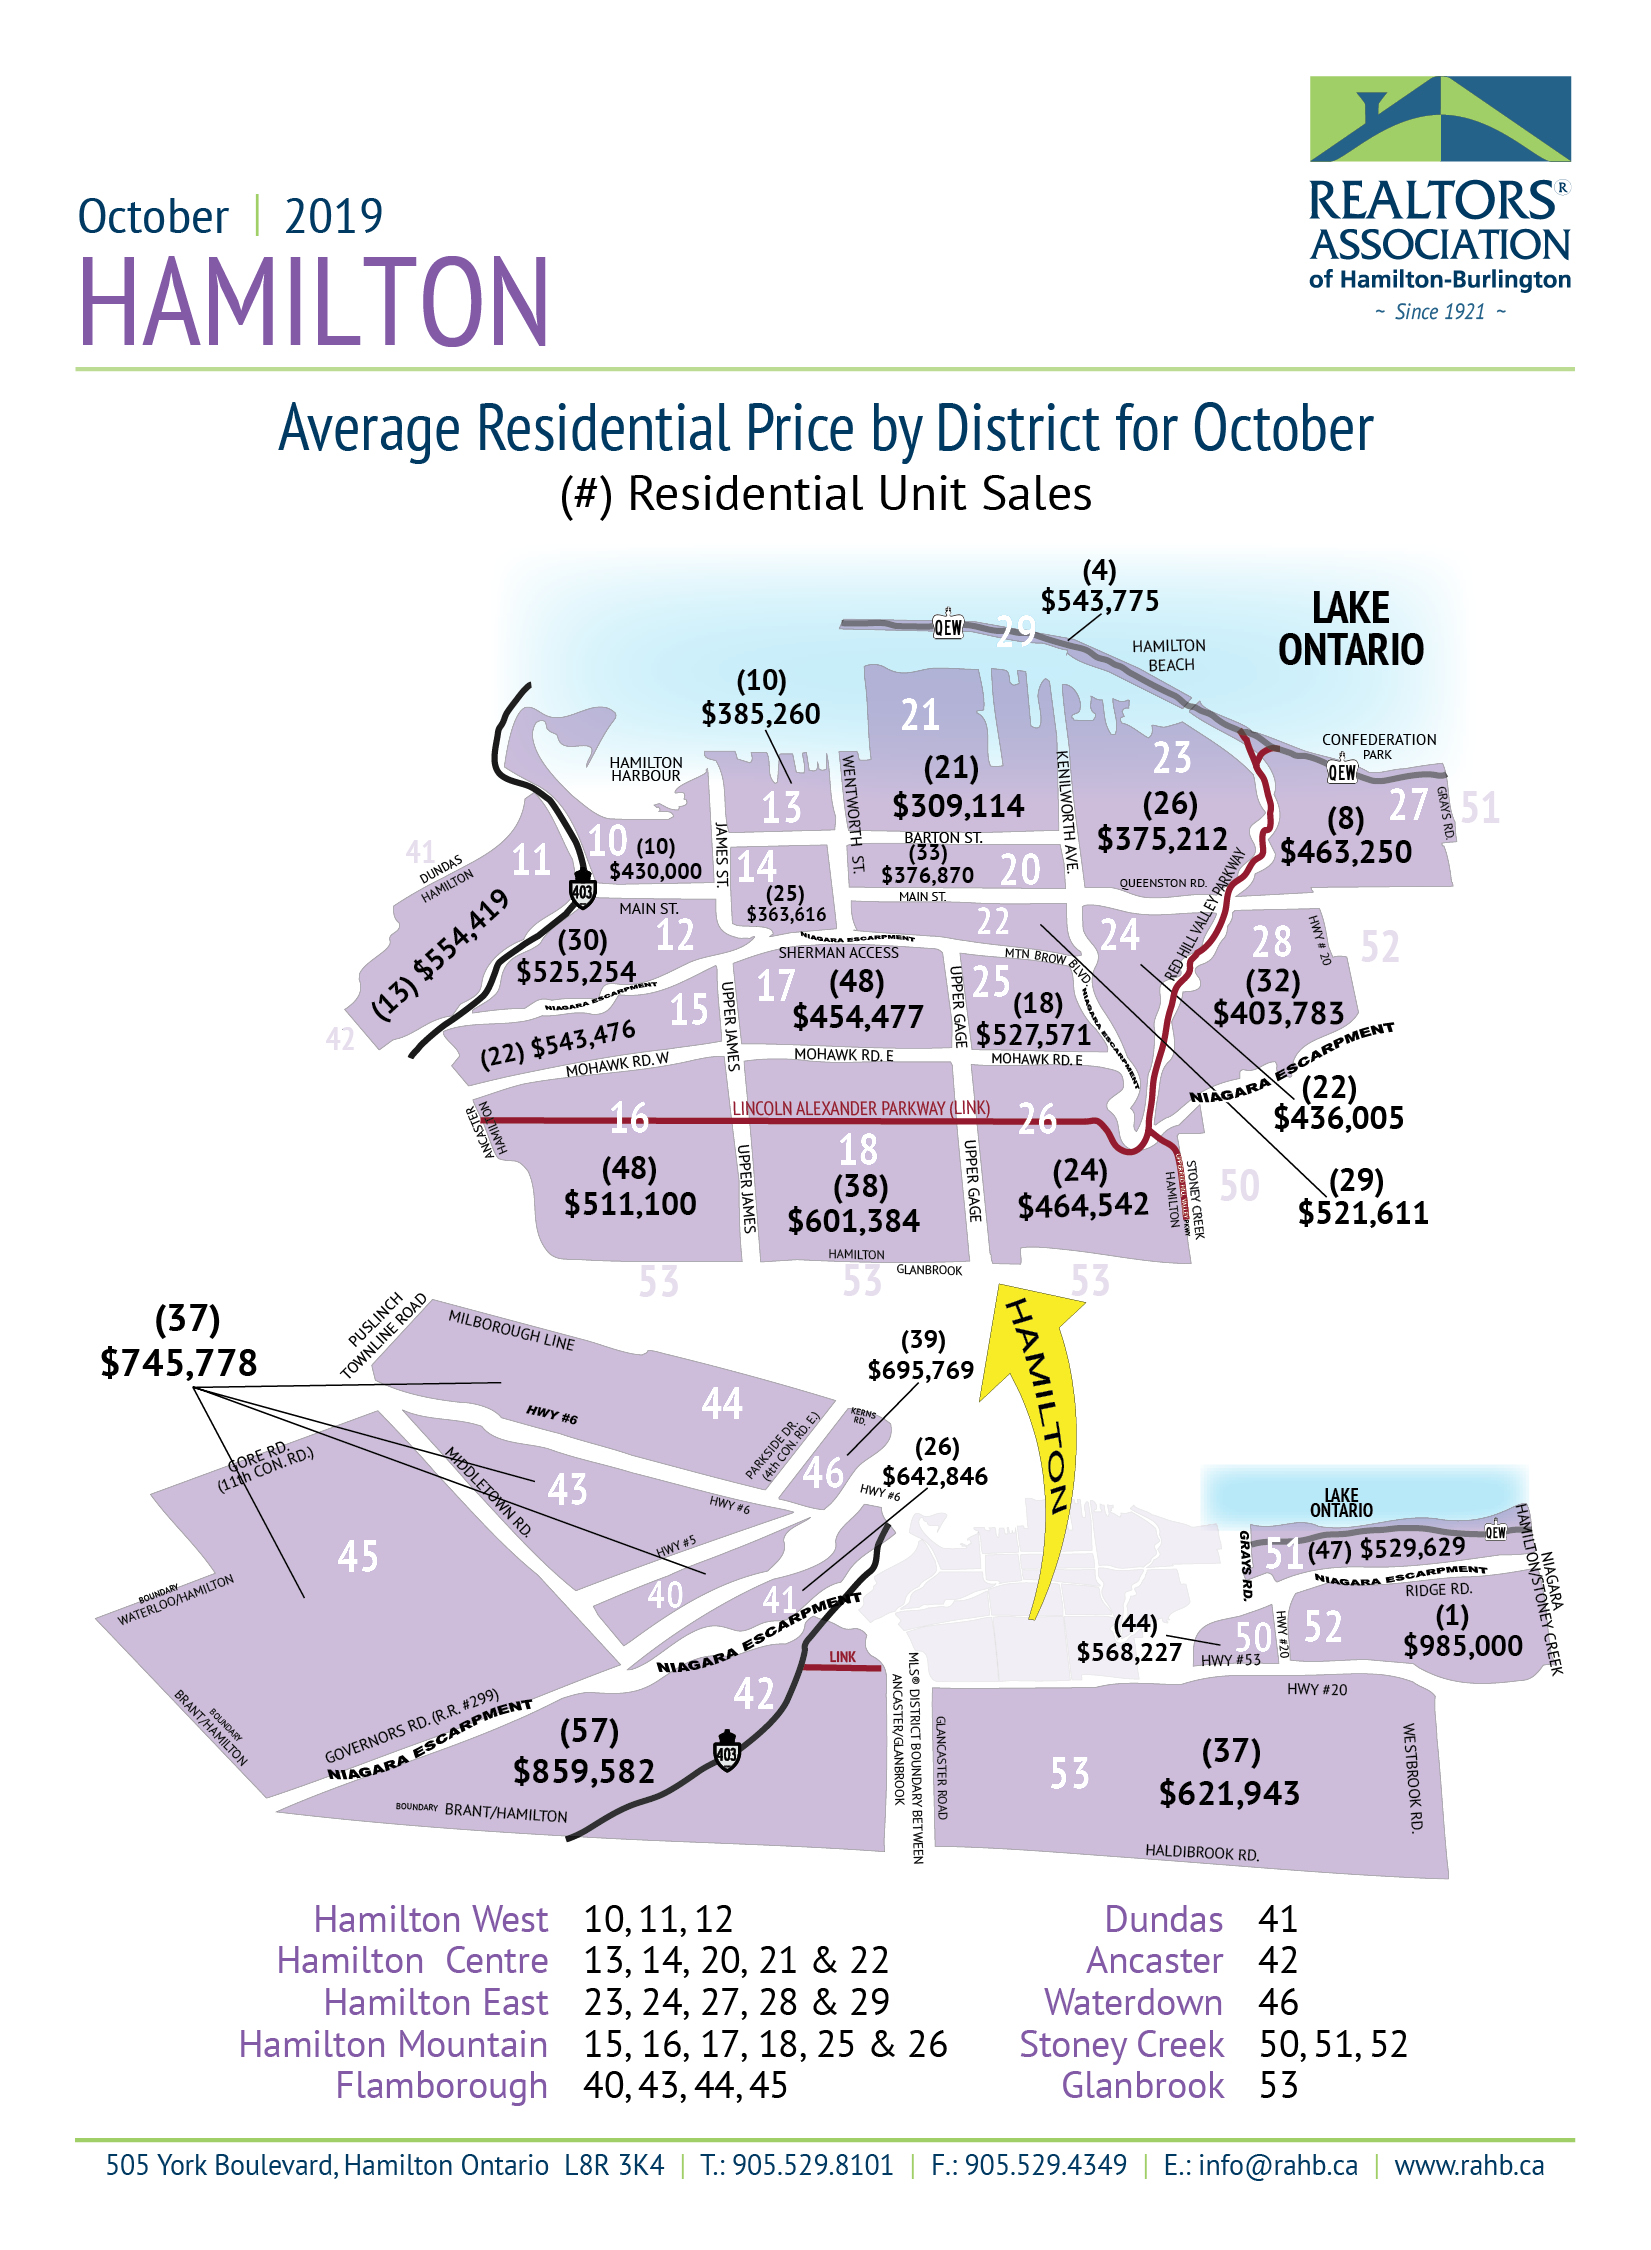
Hamilton
- Residential Real Estate Market Activity Table for Hamilton
- Hamilton Market Activity and HPI Report (197 pages)
- Hamilton Area Map
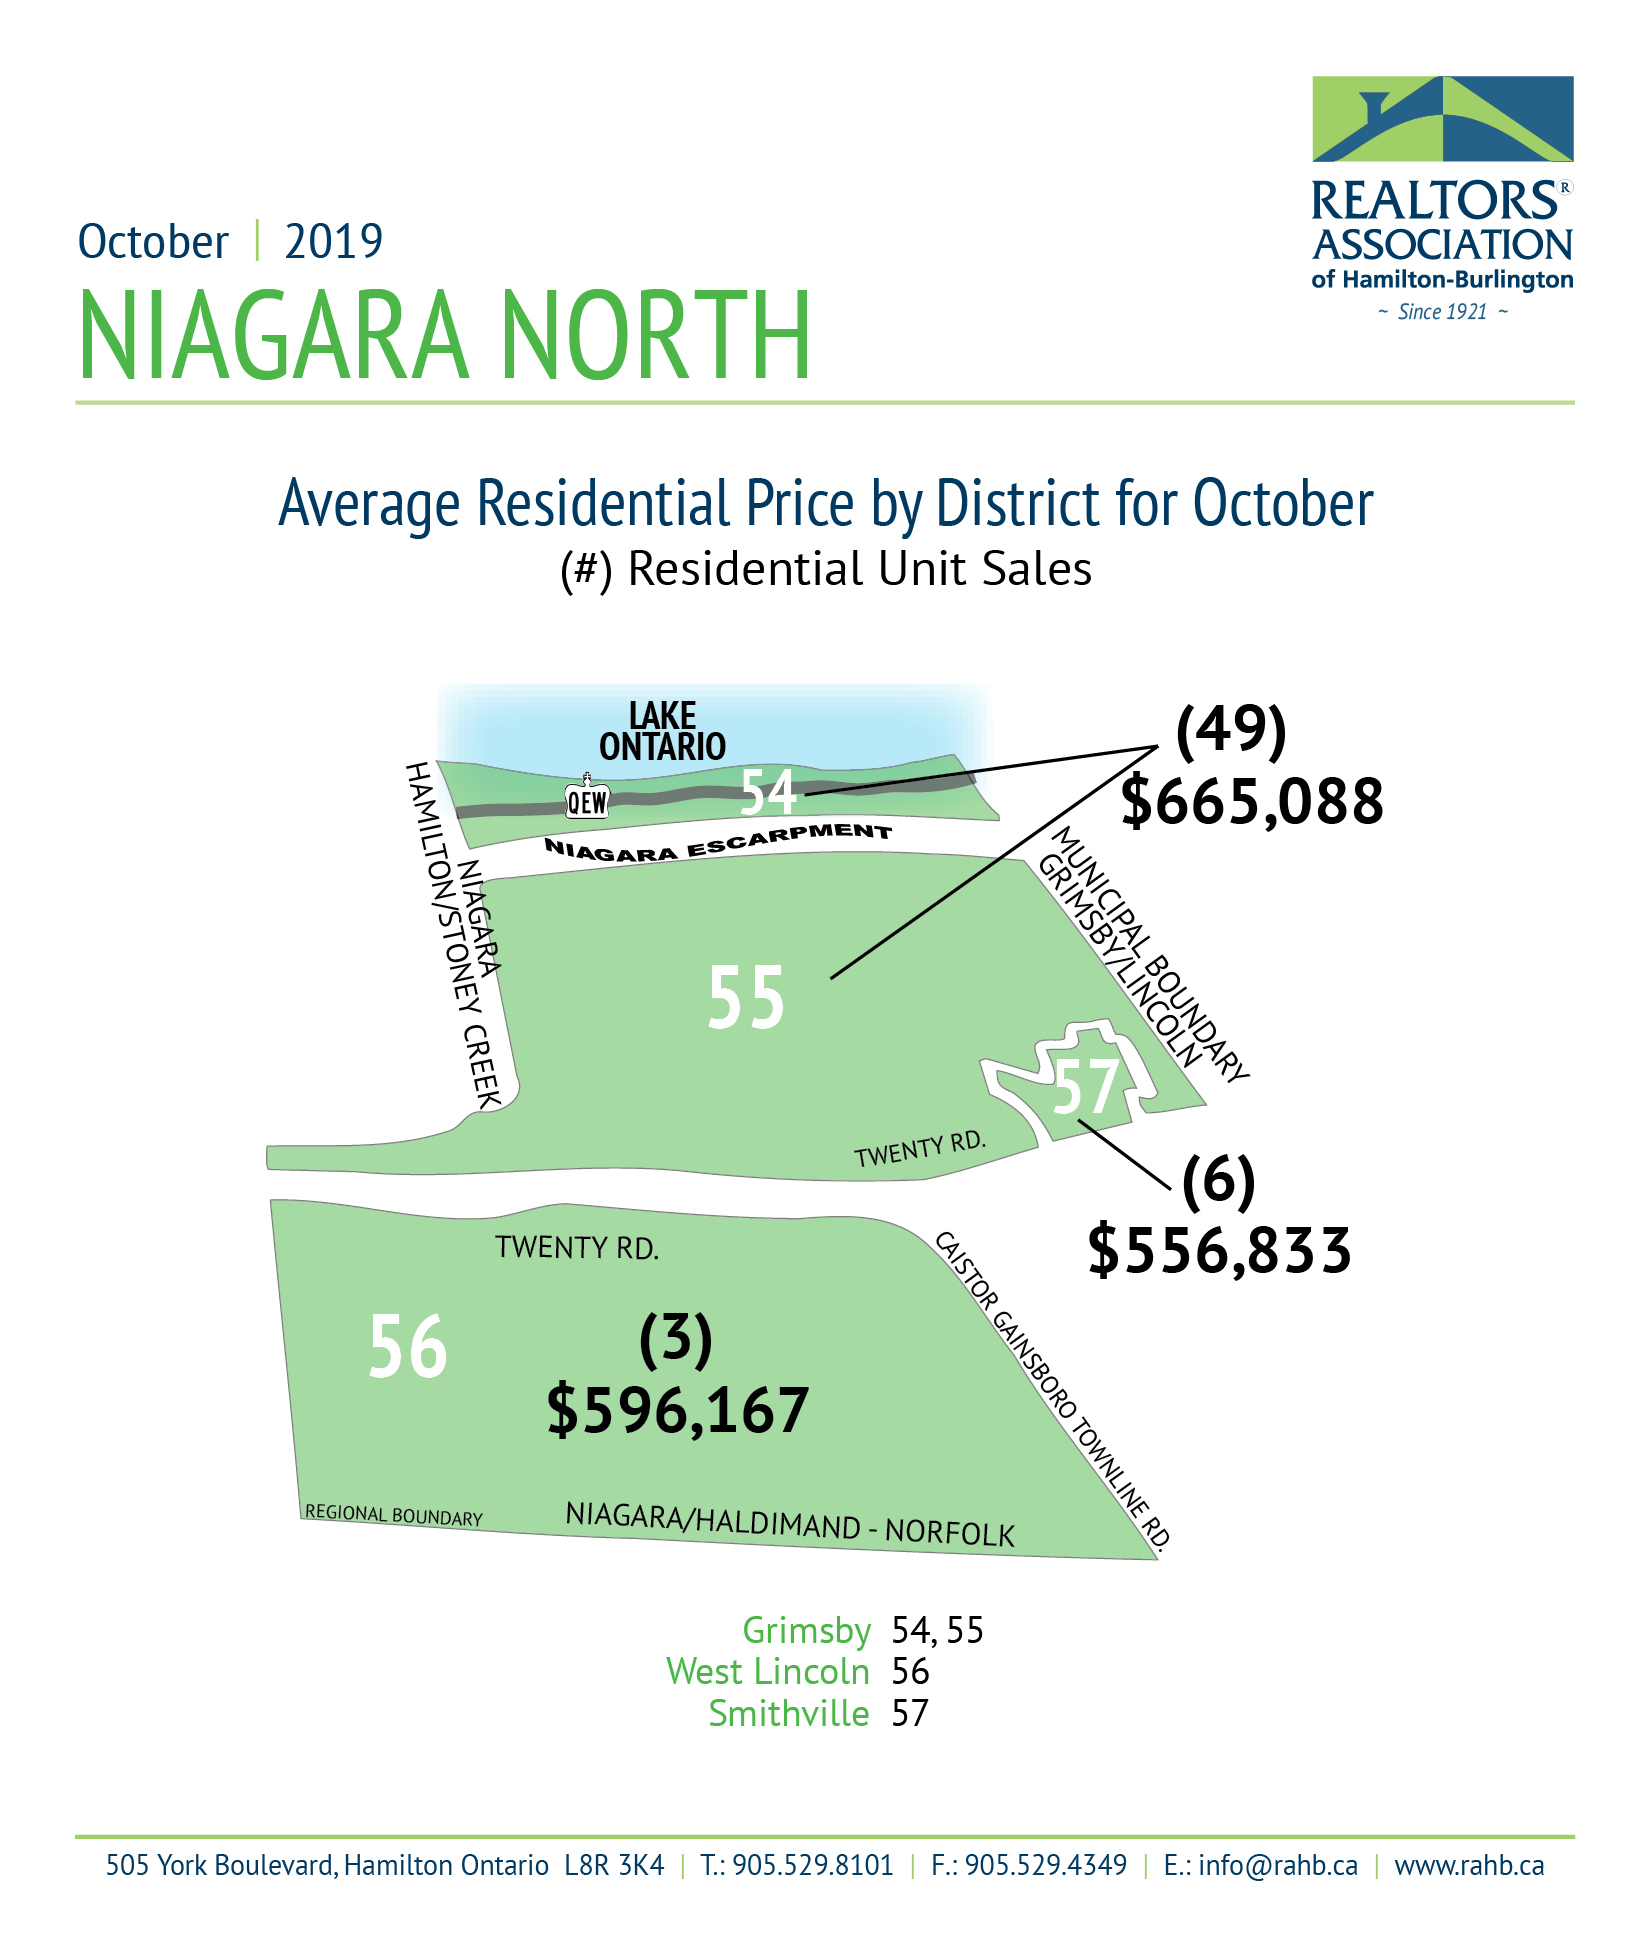
Niagara North
- Residential Real Estate Market Activity Table for Niagara North
- Niagara North Market Activity and HPI Report (31 pages)
- Niagara North Area Map