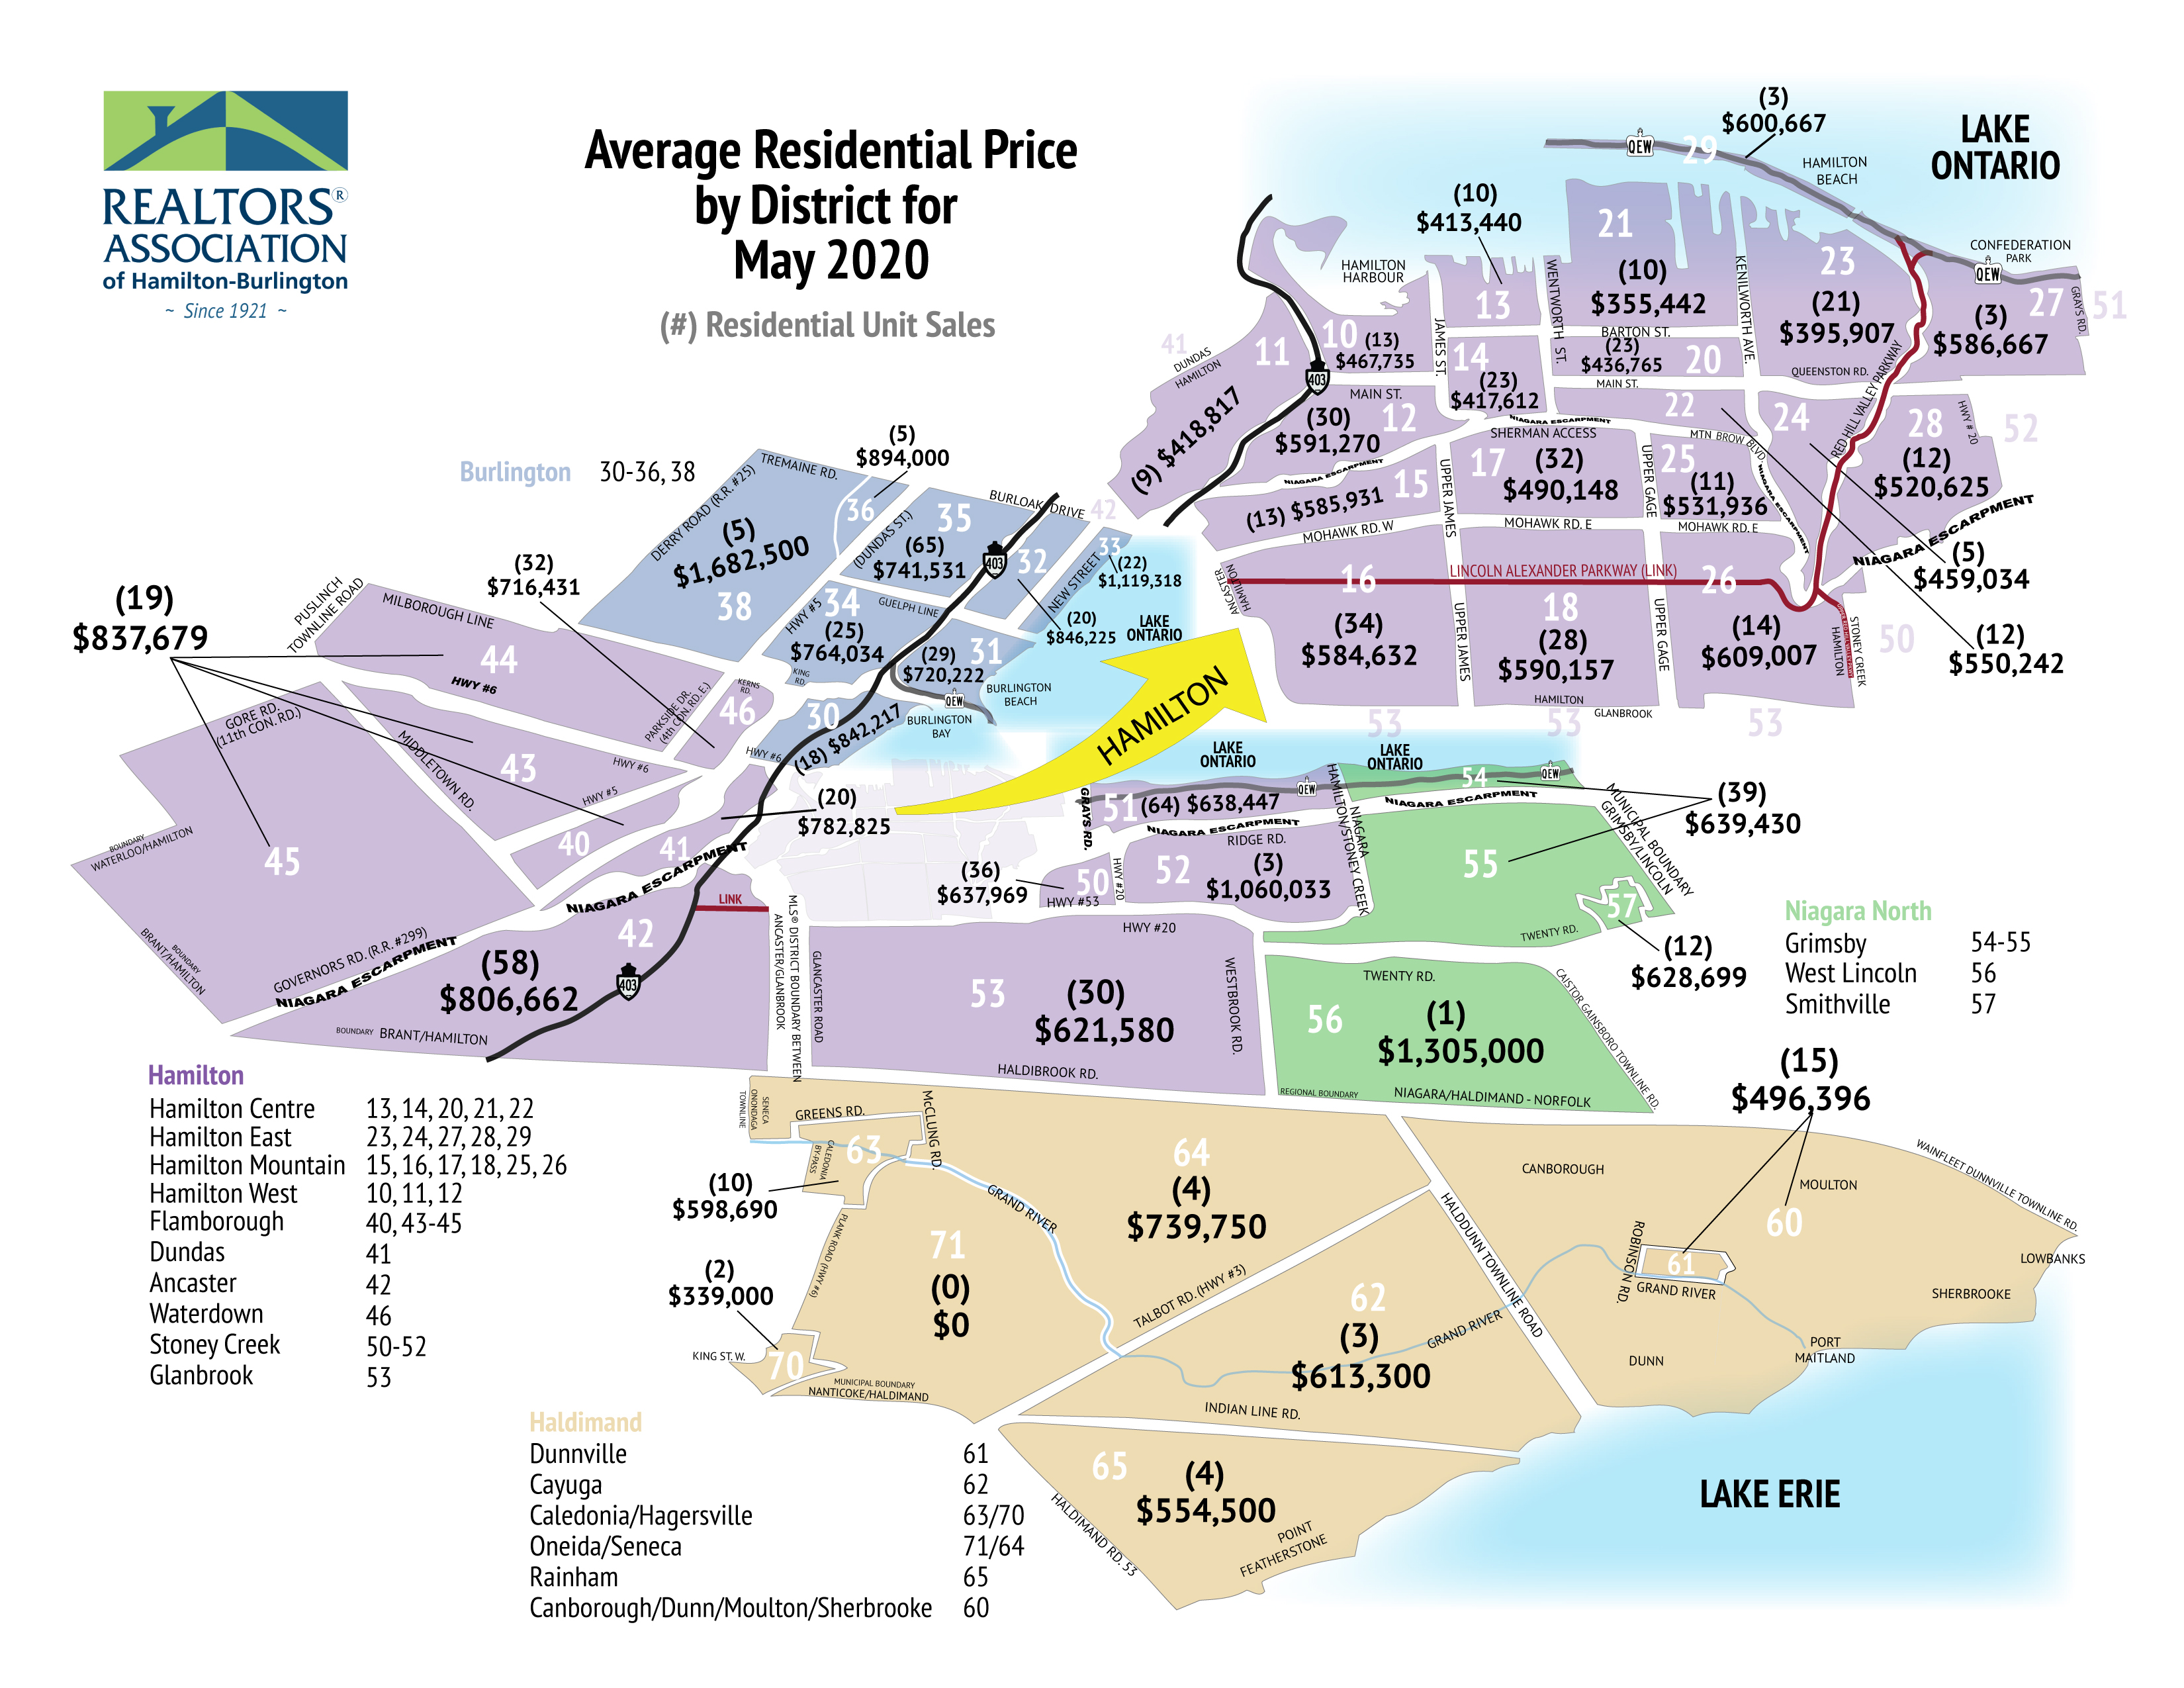
The REALTORS® Association of Hamilton-Burlington (RAHB) reported 852 sales of residential properties located within the RAHB market area were processed through the Multiple Listing Service® (MLS®) System in May 2020. Sales are down 42.2 per cent over May 2019, and up 43.4 per cent over last month. The average price for residential properties was $655,418, which is up 10 per cent from May last year, and up 6.3 per cent from last month.
Follow the links below for:
- Residential Market Activity for RAHB Area
- All RAHB Residential Market Activity and HPI Report (17 pages)
- RAHB Residential Market at a Glance
- Weekly Trends for March, April and May *NEW*
- Social Media Stats Kit
- Stats Map for Entire RAHB Area
- Market Highights*NEW*
- RAHB Commercial Activity
- Residential + Commercial Activity for RAHB Market Areas
- Historical Chart
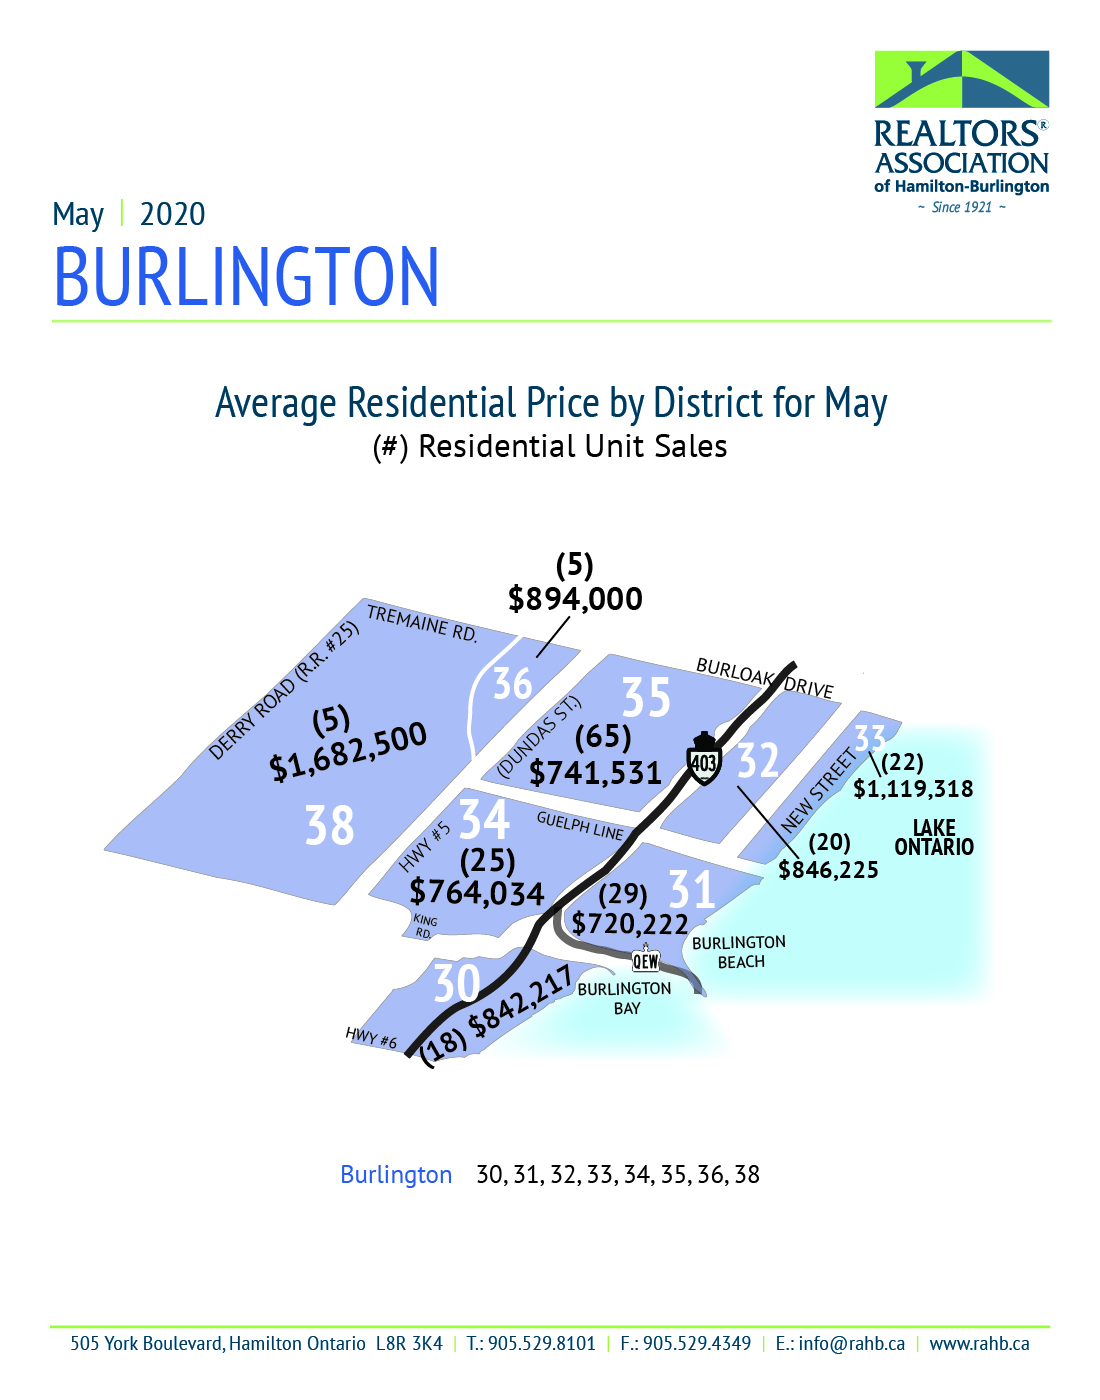
Burlington
- Residential Real Estate Market Activity Table for Burlington
- Burlington Market Activity and HPI Report (72 pages)
- Burlington Area Map
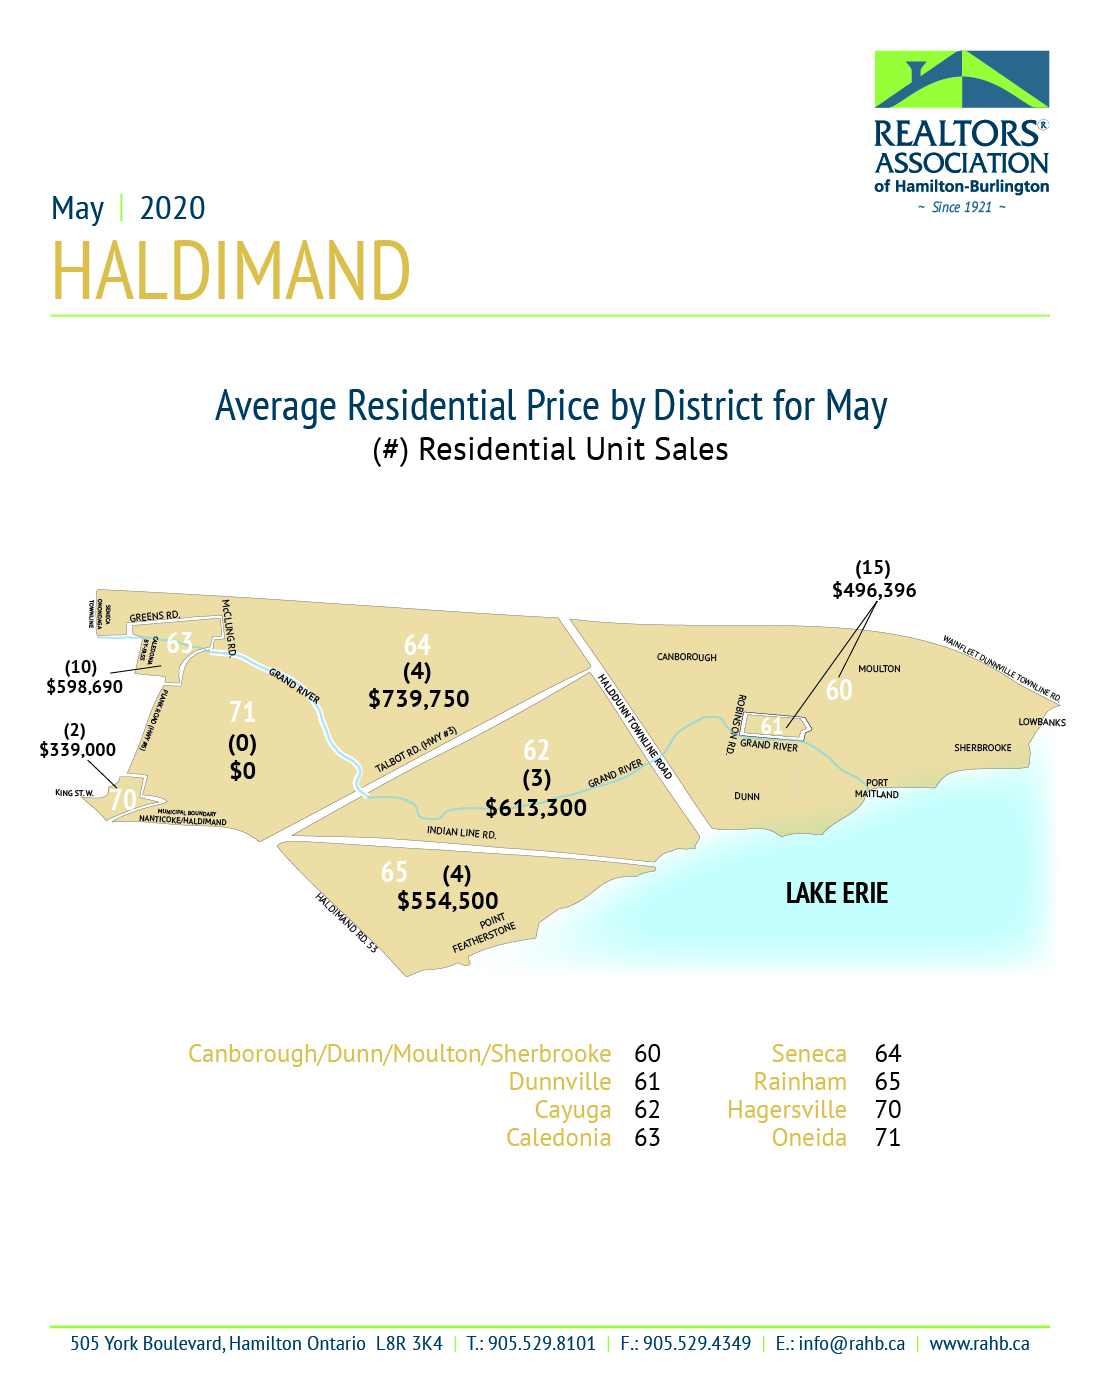
Halidmand
- Residential Real Estate Market Activity Table for Haldimand
- Haldimand Market Activity and HPI Report (58 pages)
- Haldimand Area Map
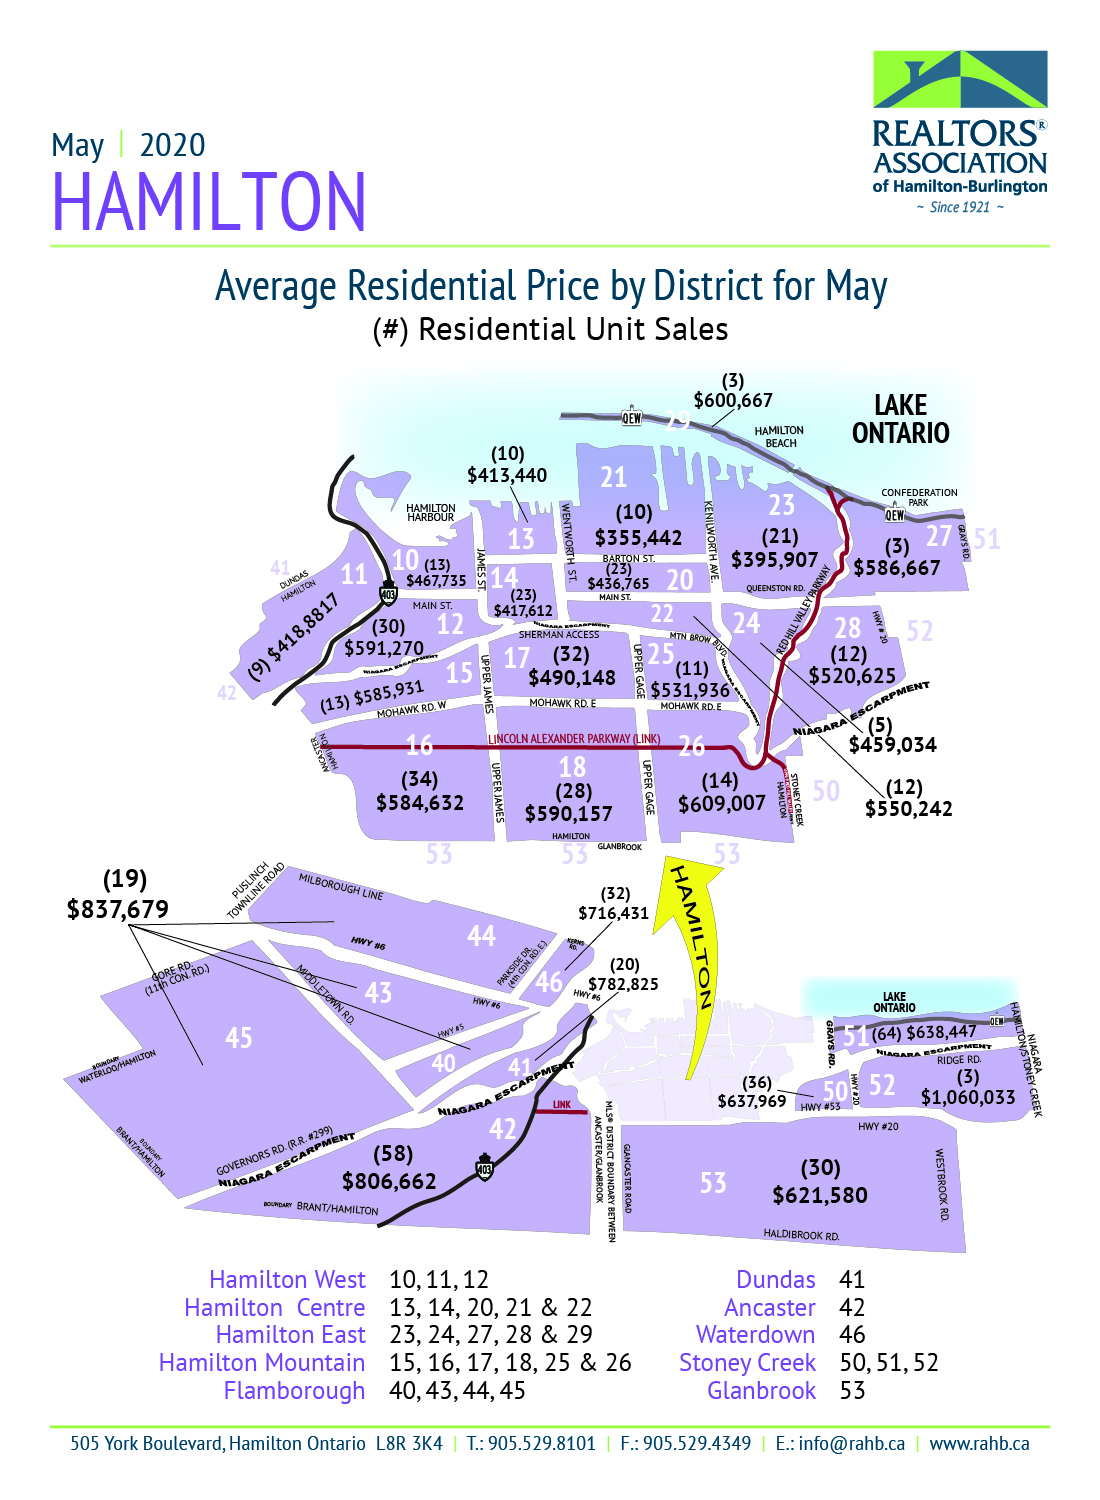
Hamilton
- Residential Real Estate Market Activity Table for Hamilton
- Hamilton Market Activity and HPI Report (197 pages)
- Hamilton Area Map
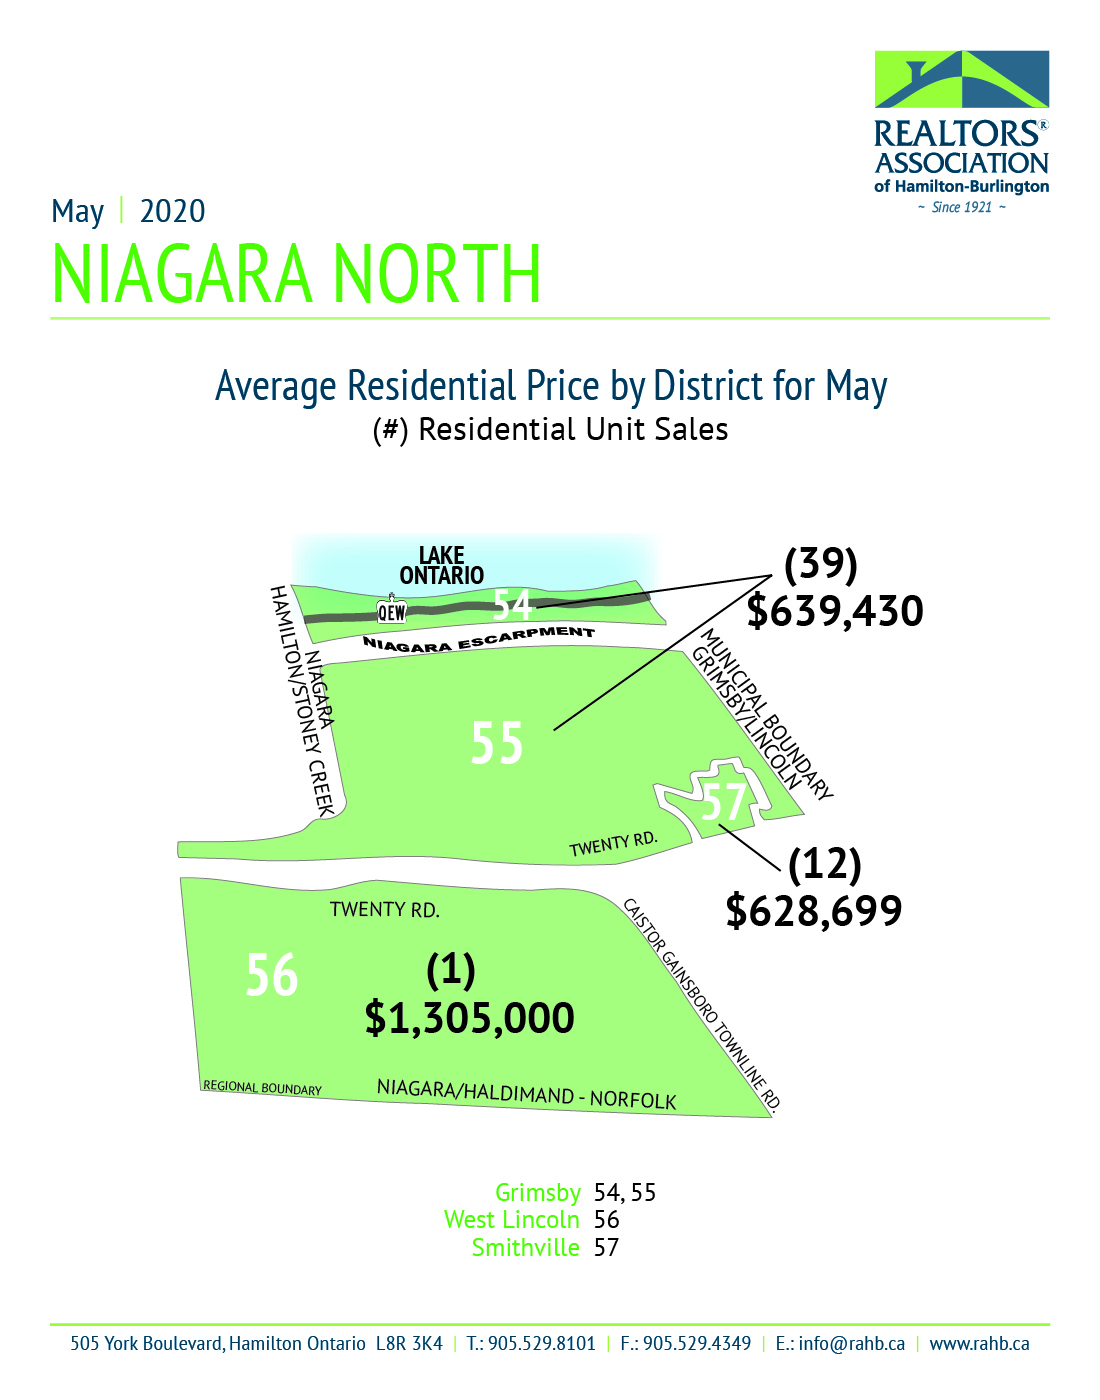
Niagara North
- Residential Real Estate Market Activity Table for Niagara North
- Niagara North Market Activity and HPI Report (31 pages)
- Niagara North Area Map