Jun 4, 2015 | MLS®, Stats & Technology |
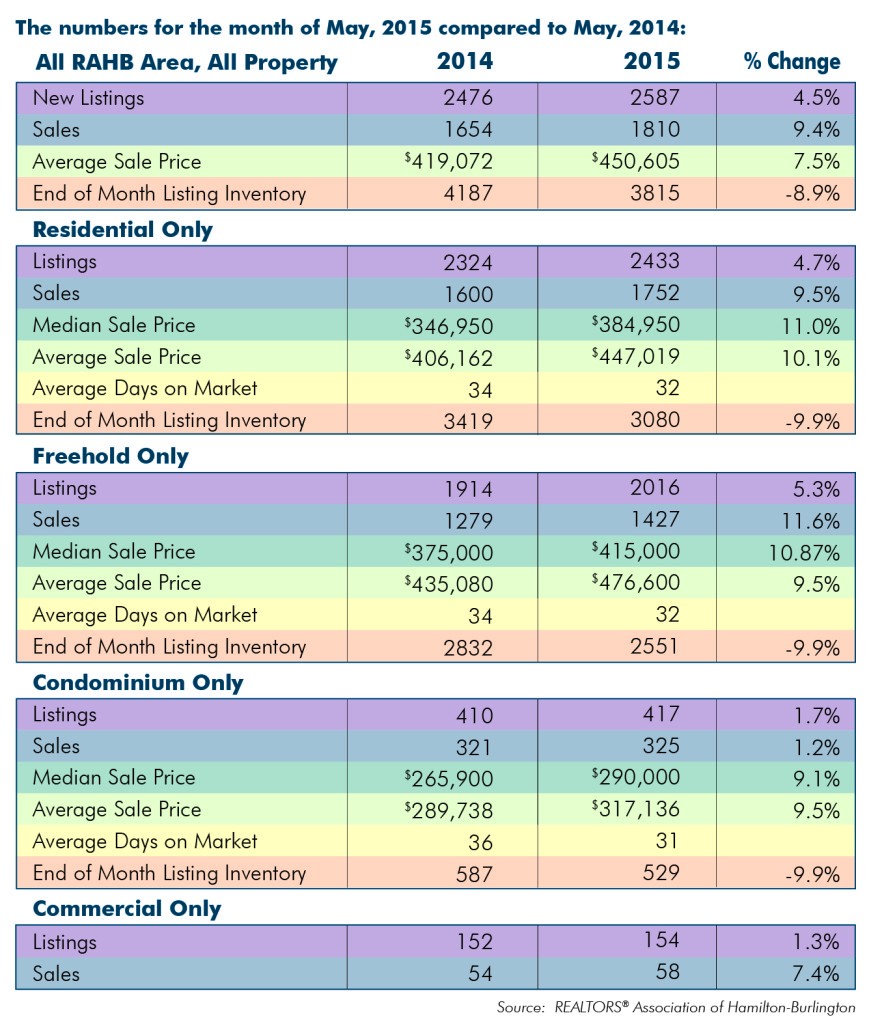
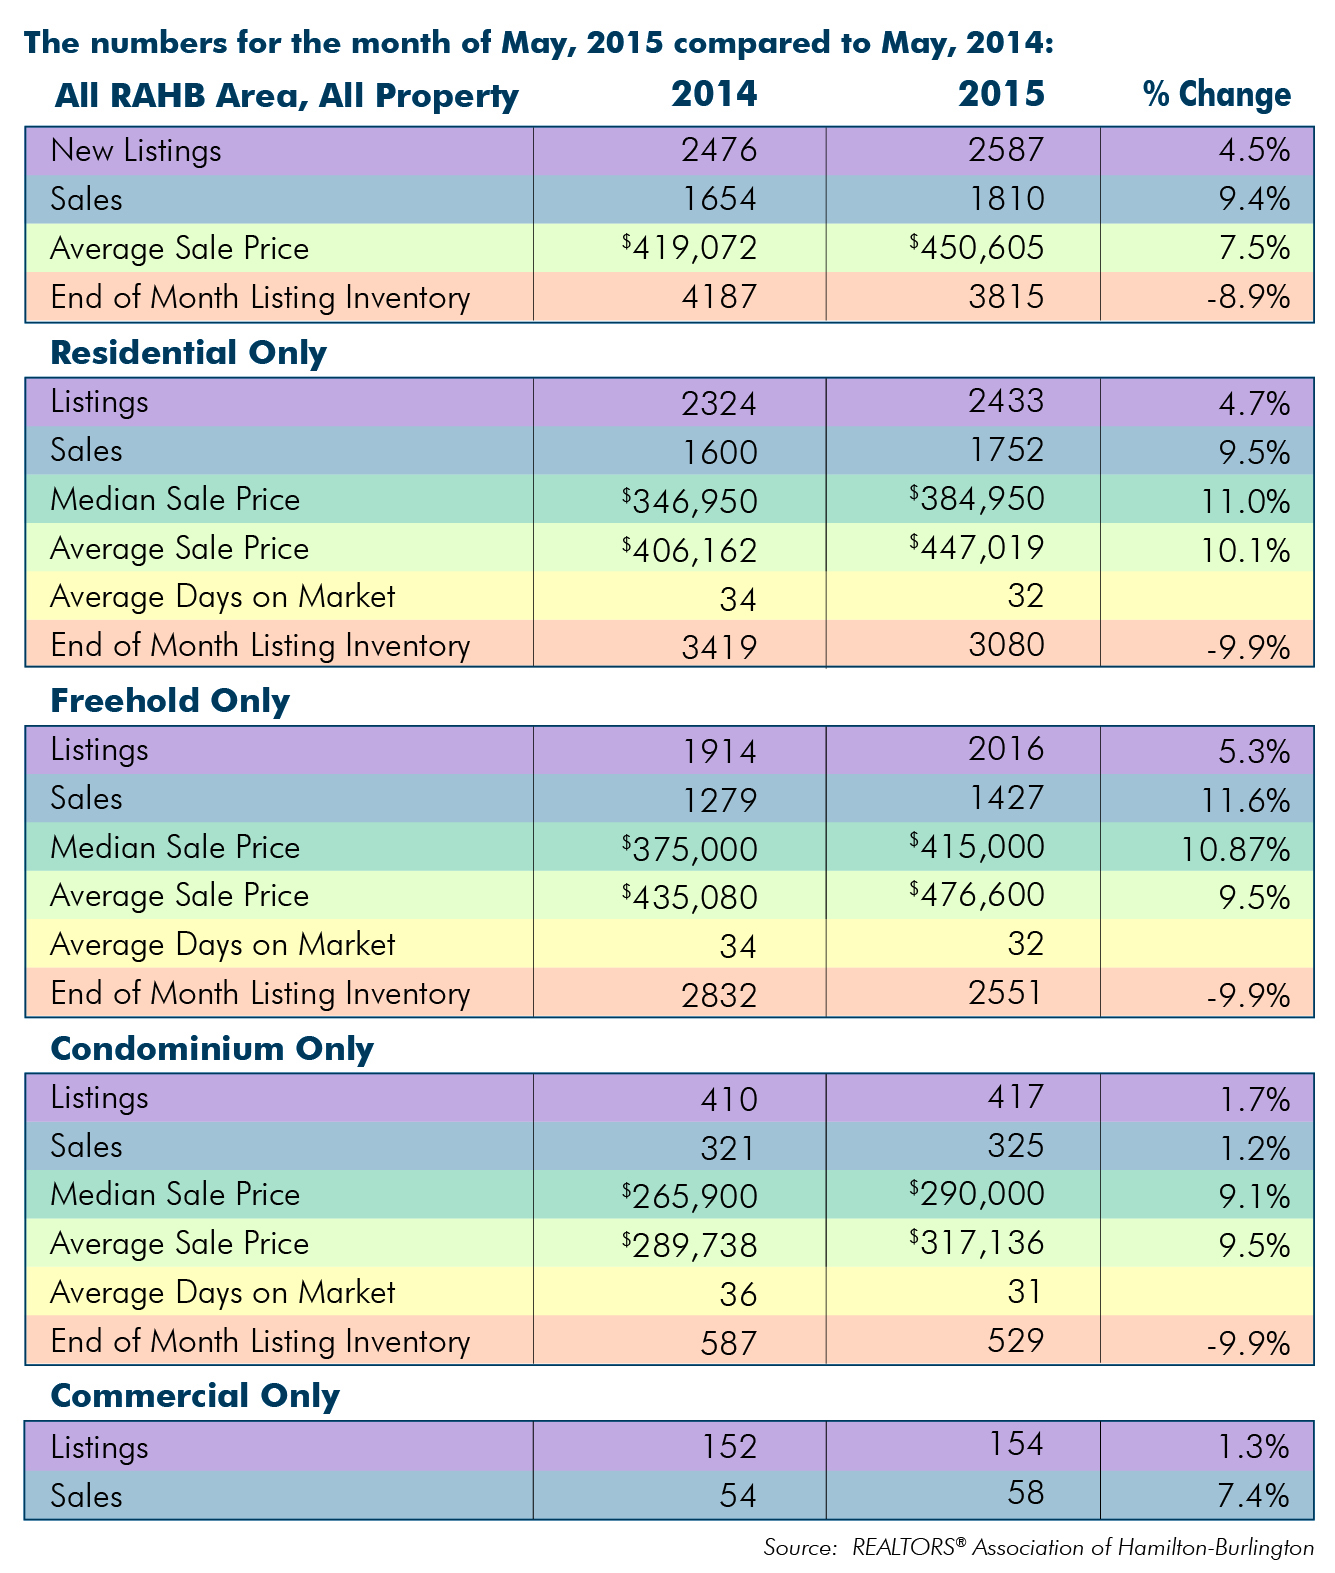
(June 3, 2015 – Hamilton, Ontario) The REALTORS® Association of Hamilton-Burlington (RAHB) reported a record 1,810 property sales processed through the RAHB Multiple Listing Service® (MLS®) system in May. This represents a 9.4 per cent increase in sales compared to May of last year, and smashes the record of 1,699 all property sales set last month.
There were 2,587 properties listed in May, an increase of 4.5 per cent compared to the same month the year prior. End-of-month listing inventory was 8.9 per cent lower than last May.
“For the second month in a row, sales in the Hamilton-Burlington area broke an all-time record,” said RAHB CEO Ross Godsoe. “To say that we’ve had a busy spring market would be an understatement. Low inventory and relatively low prices have led to properties in the old city of Hamilton to sell, on average, at or above asking.”
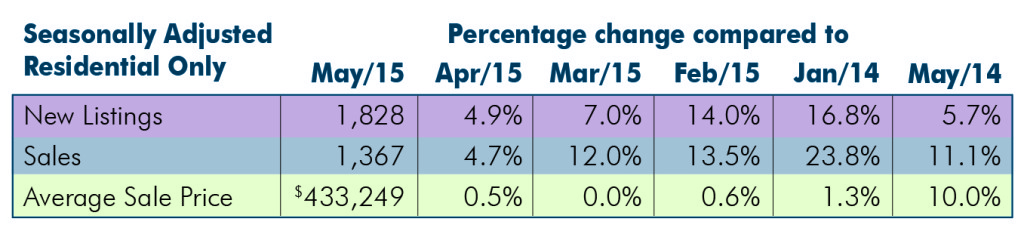
Seasonally adjusted* sales of residential properties were 11.1 per cent higher than the same month of the previous year, with the average sale price up 10 per cent for the month. Seasonally adjusted numbers of new listings were 5.7 per cent higher than the same month the year prior.
Seasonally adjusted data for residential properties for the month of May, 2015:
Actual overall residential sales of 1,752 units were 9.5 per cent higher than the previous year at the same time and also a new record for residential sales. Residential freehold sales were 11.6 per cent higher than last May while sales in the condominium market saw an increase of just 1.2 per cent.
“Listing and sale numbers continue to grow,” added Godsoe. “However, inventory is still very low, with just two months supply of listings. The Hamilton-Burlington market has favoured sellers for a while now, and remains one of the tightest markets in Canada.”
The average price of freehold properties showed an increase of 9.5 per cent compared to the same month the previous year; the average sale price in the condominium market also increased by 9.5 per cent when compared to the same period.
The average sale price is based on the total dollar volume of all properties sold in the RAHB market area. Average sale price information can be useful in establishing long term trends, but should not be used as an indicator that specific properties have increased or decreased in value.
The average days on market decreased from 34 to 32 days in the freehold market and from 36 to 31 days in the condominium market when compared to the same month the previous year.
Year to date, sales are 9.7 per cent higher compared to the same quarter last year; listings are 5.6 per cent higher than last year and the average sale price is 8.5 per cent higher for the period.
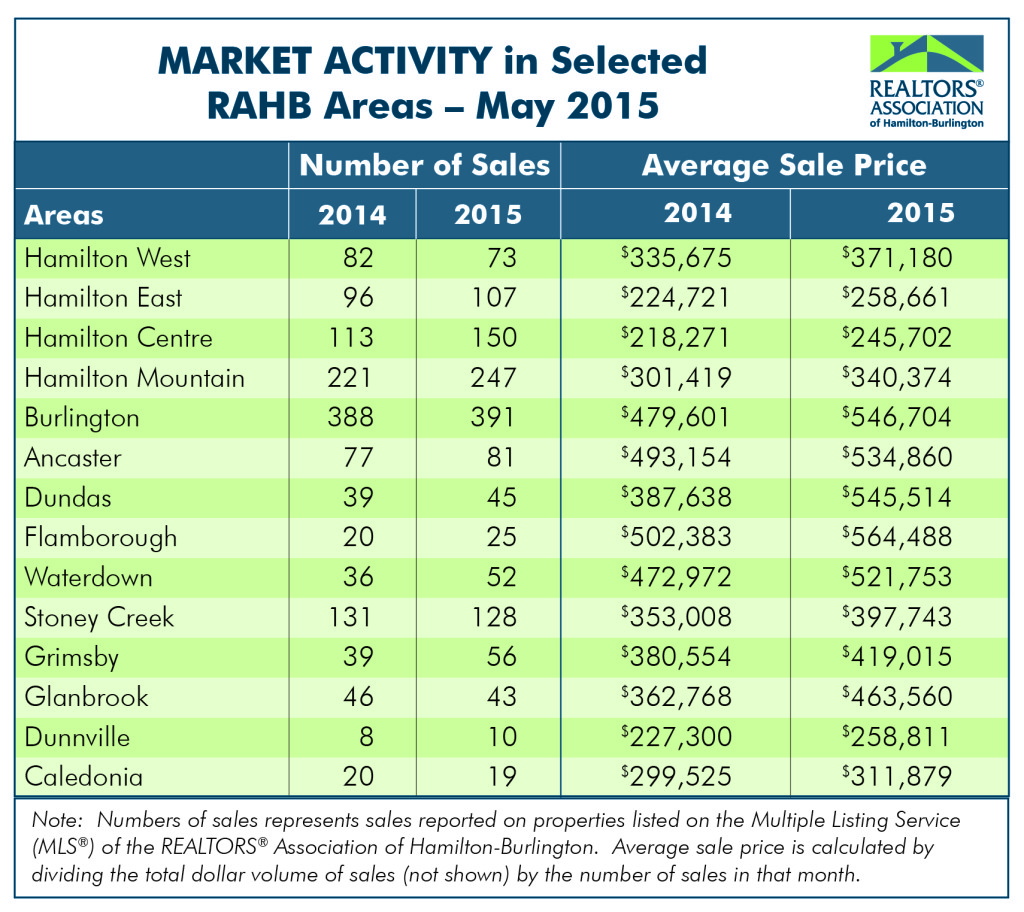
Every community in RAHB’s market area has its own localized residential market. Please refer to the accompanying chart for residential market activity in select areas in RAHB’s jurisdiction.
*Seasonal adjustment removes normal seasonal variations, enabling analysis of monthly changes and fundamental trends in the data.
Established in 1921, the REALTORS® Association of Hamilton-Burlington (RAHB) represents more than 2,700 real estate brokers and sales representatives from Hamilton, Burlington and outlying areas. Members of the association may use the REALTOR® trademark, which identifies them as real estate professionals who subscribe to a strict code of ethics. The association operates the local Multiple Listing Service® (MLS®) and provides ongoing professional education courses for its members. In addition, RAHB is an active participant in the Home Ownership Affordability Partnership (HOAP) and holds an annual auction in support of local charities. Advertisements of local MLS® property listings and information about the services provided by a REALTOR® can be found at www.REALTOR.ca. More information about RAHB is available at www.rahb.ca.
Jun 3, 2015 | MLS®, Stats & Technology |
RAHB Average Price by District – (#) Residential Unit Sales
Hamilton
Hamilton West, 10 – 12
Hamilton East, 23, 24, 27 – 29
Hamilton Centre, 13, 14, 20 – 22
Hamilton Mountain, 15 – 18, 25 & 26

Burlington – 30 – 38

Outlying
Flamborough, 40, 43 – 45
Dundas, 41
Ancaster, 42
Waterdown, 46
Stoney Creek, 50 – 52
Glanbrook, 53
Grimsby, 54 -55
West Lincoln, 56
Smithville, 57
Dunnville, 61
Cayuga, 62
Calendonia/Hagersville, 63 & 70
Onieda/Seneca, 71 & 64
Rainham, 65
Canborough/Dunn, 60
Moulton/Sherbrooke, 60

Jun 3, 2015 | MLS®, Stats & Technology |


May 7, 2015 | MLS®, Stats & Technology |
RAHB Average Price by District – (#) Residential Unit Sales
Hamilton
Hamilton West, 10 – 12
Hamilton East, 23, 24, 27 – 29
Hamilton Centre, 13, 14, 20 – 22
Hamilton Mountain, 15 – 18, 25 & 26
 Burlington – 30 – 38

Outlying
Flamborough, 40, 43 – 45
Dundas, 41
Ancaster, 42
Waterdown, 46
Stoney Creek, 50 – 52
Glanbrook, 53
Grimsby, 54 -55
West Lincoln, 56
Smithville, 57
Dunnville, 61
Cayuga, 62
Calendonia/Hagersville, 63 & 70
Onieda/Seneca, 71 & 64
Rainham, 65
Canborough/Dunn, 60
Moulton/Sherbrooke, 60

May 6, 2015 | MLS®, Stats & Technology |


May 6, 2015 | MLS®, Stats & Technology |
The REALTORS® Association of Hamilton-Burlington (RAHB) reported a record 1,699 property sales processed through the RAHB Multiple Listing Service® (MLS®) system in April. This represents a 15.7 per cent increase in sales compared to April of last year, and smashes the old record of 1,660 all property sales set in May of 2014.
There were 2,379 properties listed in April, an increase of 15.7 per cent compared to the same month the year prior. End-of-month listing inventory was 8.7 per cent lower than last April.
“The Greater Hamilton-Burlington real estate market has never seen this kind of activity,” said RAHB CEO Ross Godsoe. “There are a number of areas in Hamilton, Burlington and even outlying communities where, on average, properties are being sold for full list price or higher. It’s rare to see that kind activity as an average for an area.”
Seasonally adjusted* sales of residential properties were 13.8 per cent higher than the same month of the previous year, with the average sale price up 7.9 per cent for the month. Seasonally adjusted numbers of new listings were 4.3 per cent higher than the same month the year prior.
Seasonally adjusted data for residential properties for the month of April, 2015:

Actual overall residential sales of 1,642 units were 15.3 per cent higher than the previous year at the same time and also a new record for residential sales. Residential freehold sales were 15.7 per cent higher than last April while sales in the condominium market saw an increase of 13.6 per cent.
“Listings and sales in the residential market are well over average for the month,” added Godsoe. “Despite the increase in listings, end of month inventory is still considered low, at just over two months of inventory. That, coupled with a high sales to listing ratio, confirms we are still firmly in a seller’s market.”
The average price of freehold properties showed an increase of 7.6 per cent compared to the same month the previous year; the average sale price in the condominium market increased by 9.7 per cent when compared to the same period.
The average sale price is based on the total dollar volume of all properties sold in the RAHB market area. Average sale price information can be useful in establishing long term trends, but should not be used as an indicator that specific properties have increased or decreased in value.
The average days on market decreased from 34 to 27 days in the freehold market and from 35 to 33 days in the condominium market when compared to the same month the previous year.
Year to date, sales are 9.7 per cent higher compared to the same quarter last year; listings are 5.6 per cent higher than last year and the average sale price is 8.5 per cent higher for the period.

Every community in RAHB’s market area has its own localized residential market. Please refer to the accompanying chart for residential market activity in select areas in RAHB’s jurisdiction.

*Seasonal adjustment removes normal seasonal variations, enabling analysis of monthly changes and fundamental trends in the data.
Established in 1921, the REALTORS® Association of Hamilton-Burlington (RAHB) represents more than 2,700 real estate brokers and sales representatives from Hamilton, Burlington and outlying areas. Members of the association may use the REALTOR® trademark, which identifies them as real estate professionals who subscribe to a strict code of ethics. The association operates the local Multiple Listing Service® (MLS®) and provides ongoing professional education courses for its members. In addition, RAHB is an active participant in the Home Ownership Affordability Partnership (HOAP) and holds an annual auction in support of local charities. Advertisements of local MLS® property listings and information about the services provided by a REALTOR® can be found at www.REALTOR.ca. More information about RAHB is available at www.rahb.ca.
May 6, 2015 | MLS®, Stats & Technology |
RECO recently provided information about advertising listings as “coming soon” (For the RECOrd, April 9). The article suggests there are appropriate and inappropriate ways to advertise listings that will soon be listed and/or active on the MLS® System.
Please note that RAHB Rules do not allow advertising “Coming Soon”. Section 10, Advertising in the MLS® Rules and Regulations states:
Section 10 Advertising
10.05 No marketing of any property, including placing a sign on any property, is permitted until the commencement date of the Listing Agreement pertaining to such property.
Therefore, there is no appropriate way for RAHB members to advertise a property before the commencement date of the listing.
May 6, 2015 | MLS®, Stats & Technology |
Property Panorama will be launching InstaView Update 2.0 on May 7, 2015 and you will see noticeable improvements.
This Over-the-Air (OTA) update will be released systematically, and you will not experience gaps in service or be required to make manual changes. All your previous user settings will be honoured and automatically implemented into InstaView 2.0.
Once the update has been launched, you will notice changes that include:
Visual Design: a new and improved Members Area Layout, including a new colourful theme, graphics and animations.
Navigation: Quickly navigate through your Member’s Areas with the all-new streamlined single-column navigation. With this simplified designed, you will be able to easily navigate between your Tours, Statistics, Leads, Settings, and all other facets of the InstaView portfolio.
Increased Performance: Minimized load times provide the most responsive site possible.
Updated Printer Friendly Flyers: InstaView 2.0 introduces all-new PDF flyers. These flyers have a fully updated design and are displayed in a vertical layout for easy printing.
Automatic Social Media Syndication: One-click submission of tours to popular social media sights will be even easier! You will be able to choose to have tours automatically syndicated to your personal accounts any time a change is made.
Watch for these great changes to InstaView on May 7.
Apr 6, 2015 | MLS®, Stats & Technology |
The REALTORS® Association of Hamilton-Burlington (RAHB) reported 1397 property sales processed through the RAHB Multiple Listing Service® (MLS®) system in March. This represents a 10.9 per cent increase in sales compared to March of last year.
There were 2170 properties listed in February, an increase of 14.2 per cent compared to the same month the year prior. End-of-month listing inventory was 7.7 per cent lower than last March.
“The spring market is definitely upon us,” said RAHB CEO Ross Godsoe. “In March we saw increases in listings and sales over last year, as well as in comparison to the average for the last ten years.”
Seasonally adjusted* sales of residential properties were 10.9 per cent higher than the same month of the previous year, with the average sale price up 9.6 per cent for the month. Seasonally adjusted numbers of new listings were 1.9 per cent higher than the same month the year prior.
Seasonally adjusted data for residential properties for the month of March, 2015:

Actual overall residential sales were 11.1 per cent higher than the previous year at the same time. Residential freehold sales were 11.9 per cent higher than last March while sales in the condominium market saw an increase of eight per cent.
“It’s still a tight market in the Greater Hamilton-Burlington market,” added Godsoe. “While we saw more listings come on the market in March, we still have a relatively low inventory of listings. The seller’s market continues in our area.”
The average price of freehold properties showed an increase of 7.6 per cent compared to the same month the previous year; the average sale price in the condominium market increased by 7.4 per cent when compared to the same period.
The average sale price is based on the total dollar volume of all properties sold in the RAHB market area. Average sale price information can be useful in establishing long term trends, but should not be used as an indicator that specific properties have increased or decreased in value.
The average days on market decreased from 37 to 34 days in the freehold market and from 39 to 34 days in the condominium market when compared to the same month the previous year.
Year to date, sales are 6.8 per cent higher compared to the same quarter last year; listings are 5.8 per cent higher than last year and the average sale price is 9.2 per cent higher for the period.

Every community in RAHB’s market area has its own localized residential market. Please refer to the accompanying chart for residential market activity in select areas in RAHB’s jurisdiction.

*Seasonal adjustment removes normal seasonal variations, enabling analysis of monthly changes and fundamental trends in the data.
Established in 1921, the REALTORS® Association of Hamilton-Burlington (RAHB) represents more than 2,700 real estate brokers and sales representatives from Hamilton, Burlington and outlying areas. Members of the association may use the REALTOR® trademark, which identifies them as real estate professionals who subscribe to a strict code of ethics. The association operates the local Multiple Listing Service® (MLS®) and provides ongoing professional education courses for its members. In addition, RAHB is an active participant in the Home Ownership Affordability Partnership (HOAP) and holds an annual auction in support of local charities. Advertisements of local MLS® property listings and information about the services provided by a REALTOR® can be found at www.REALTOR.ca. More information about RAHB is available at www.rahb.ca.
Apr 6, 2015 | MLS®, Stats & Technology |


Apr 6, 2015 | MLS®, Stats & Technology |
RAHB Average Price by District – (#) Residential Unit Sales
Hamilton
Hamilton West, 10 – 12
Hamilton East, 23, 24, 27 – 29
Hamilton Centre, 13, 14, 20 – 22
Hamilton Mountain, 15 – 18, 25 & 26

Burlington – 30 – 38

Outlying
Flamborough, 40, 43 – 45
Dundas, 41
Ancaster, 42
Waterdown, 46
Stoney Creek, 50 – 52
Glanbrook, 53
Grimsby, 54 -55
West Lincoln, 56
Smithville, 57
Dunnville, 61
Cayuga, 62
Calendonia/Hagersville, 63 & 70
Onieda/Seneca, 71 & 64
Rainham, 65
Canborough/Dunn, 60
Moulton/Sherbrooke, 60

Mar 19, 2015 | MLS®, Stats & Technology |
Recently RAHB has been receiving requests to make sales changes to amend the selling salesperson’s name.
When the listing brokerage reports the sale, they likely report the selling salesperson to be the salesperson who presented the offer and completed the deal. However, many members work as part of a team, on behalf of a specific member, and prefer sales to be credited to the team leader.
When you are the selling salesperson on an offer but wish your team leader to be credited with the sale, you must ask the listing brokerage to amend the sale information. You must do this as soon as possible, as the listing brokerage must report the amendment within five business days of the original report of the sale, as per RAHB’s MLS® Policy:
Sales
Any corrections to a firm Agreement of Purchase and Sale report, with the exception of revisions to the closing date, must be submitted within five (5) business days of the original report of sale.


