Nov 9, 2015 | MLS®, Stats & Technology |
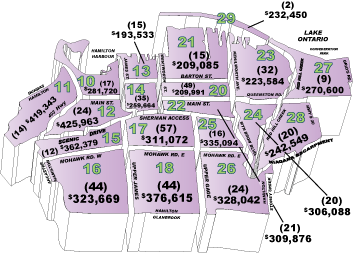
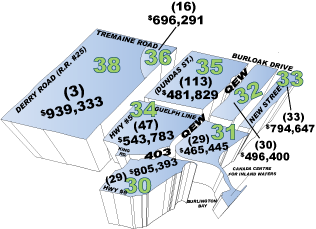
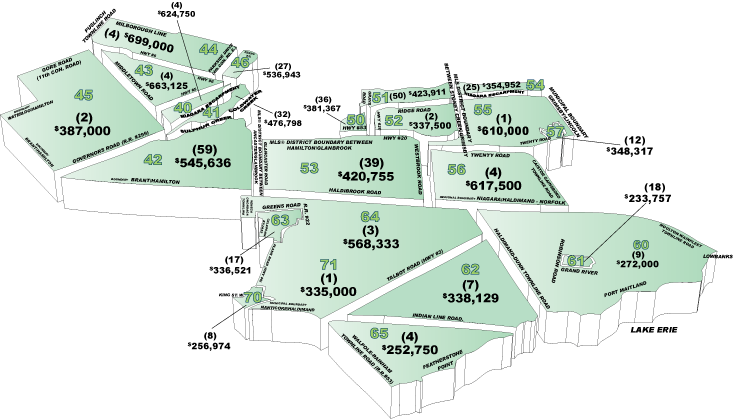
RAHB Average Price by District – (#) Residential Unit Sales
Hamilton
Hamilton West, 10 – 12
Hamilton East, 23, 24, 27 – 29
Hamilton Centre, 13, 14, 20 – 22
Hamilton Mountain, 15 – 18, 25 & 26
Burlington, 30 – 36, 38
Outlying
Flamborough, 40, 43 – 45
Dundas, 41
Ancaster, 42
Waterdown, 46
Stoney Creek, 50 – 52
Glanbrook, 53
Grimsby, 54 -55
West Lincoln, 56
Smithville, 57
Dunnville, 61
Cayuga, 62
Calendonia/Hagersville, 63 & 70
Onieda/Seneca, 71 & 64
Rainham, 65
Canborough/Dunn, 60
Nov 9, 2015 | MLS®, Stats & Technology |


Oct 14, 2015 | MLS®, Stats & Technology |
RAHB Average Price by District – (#) Residential Unit Sales
Hamilton
Hamilton West, 10 – 12
Hamilton East, 23, 24, 27 – 29
Hamilton Centre, 13, 14, 20 – 22
Hamilton Mountain, 15 – 18, 25 & 26

Burlington, 30 – 36, 38

Outlying
Flamborough, 40, 43 – 45
Dundas, 41
Ancaster, 42
Waterdown, 46
Stoney Creek, 50 – 52
Glanbrook, 53
Grimsby, 54 -55
West Lincoln, 56
Smithville, 57
Dunnville, 61
Cayuga, 62
Calendonia/Hagersville, 63 & 70
Onieda/Seneca, 71 & 64
Rainham, 65
Canborough/Dunn, 60


Oct 14, 2015 | MLS®, Stats & Technology |


Oct 14, 2015 | MLS®, Stats & Technology |
(October 6, 2015 – Hamilton, Ontario) The REALTORS® Association of Hamilton-Burlington (RAHB) reported 1,387 sales were processed through the RAHB Multiple Listing Service® (MLS®) System in September. Sales were 8.2 per cent higher than the same month last year and 25.2 per cent higher than the 10-year average, and were a record for the month of September.
There were 2,134 properties listed in September, an increase of 4.9 per cent compared to September of last year.
“This has been quite the year for breaking monthly and all-time sales records,” said RAHB CEO George O’Neill. “The trend continued last month with record-breaking sales for the month of September. The real estate market in the Greater Hamilton-Burlington area continues to perform above expectations.”
Seasonally adjusted* sales of residential properties were 7.9 per cent higher than the same month of the previous year, with the average sale price up 8.8 per cent for the month. Seasonally adjusted numbers of new listings were 4.9 per cent higher than the same month the year prior.
Seasonally adjusted data for residential properties for the month of September, 2015:

Actual overall residential sales of 1,319 units were 7.8 per cent higher than the same month last year. Residential freehold sales were 8.5 per cent higher than last September while sales in the condominium market increased by 4.7 per cent.
The average price of freehold properties showed an increase of 9.3 per cent compared to the same month the previous year; the average sale price in the condominium market increased by 5.7 per cent when compared to the same period.
The average sale price is based on the total dollar volume of all properties sold by RAHB members. Average sale price information can be useful in establishing long term trends, but should not be used as an indicator that specific properties have increased or decreased in value.
“Over the past few months, much has been made about the increase in average sale price compared to last year, and everyone seems to think the prices just keep going up and up,” noted O’Neill. “That is true only in comparison to last year. If you look at the average sale price since February – but not including last month when we had those two multi-million dollar sales which skewed our average sale price – the average sale price has varied by about only $15,000, and it’s been going up and down from month to month. The average sale price, overall, is actually quite stable.”
The average days on market decreased from 38 to 33 days in the freehold market and from 44 to 35 days in the condominium market when compared to the same month the previous year.
Year to date, sales are 11.1 per cent higher compared to the same period last year; listings are seven per cent higher than last year and the average sale price is 8.7 per cent higher for the period.

Every community in RAHB’s market area has its own localized residential market. Please refer to the accompanying chart for residential market activity in select areas in RAHB’s jurisdiction.
*Seasonal adjustment removes normal seasonal variations, enabling analysis of monthly changes and fundamental trends in the data.


Oct 14, 2015 | MLS®, Stats & Technology |
Are you using the new Edge browser in Windows 10? You should be aware that Edge is not supported by WEBForms®, so it will not work. Use Internet Explorer, Google Chrome or Firefox to access WEBForms®.
Oct 14, 2015 | MLS®, Stats & Technology |
The Board of Directors recently approved a change to the policy requiring mandatory training for broker loading.
Effective immediately, mandatory training is no longer required before broker load privileges can be extended to members, office administrators and administrative assistants. Brokers of Record/Managers now need only complete the Broker Load Permission Form to authorize members in their office, office administrators and administrative assistants to broker load. The form must be completed in full and returned to the MLS® department (attention Pam Morton).
The form is available on REALTOR Link® under the Member Services tab. For more information, contact the MLS® department or Corporate Services department.
Oct 14, 2015 | MLS®, Stats & Technology |
Dailies and Topsheets were essentially hot sheets used to conveniently access listing data and sales information. RAHB staff manually prepared them on a daily basis.
Dailies and Topsheets were discontinued as of September 25, 2015. Did you know that you can create your own search within Matrix that will allow you to quickly compile that same information? (more…)
Sep 9, 2015 | MLS®, Stats & Technology |
Here’s what’s happening with the new Regional MLS® System!
- The preview period for RAHB, the other STARRS associations and the Oakville-Milton board has begun and members now have access to Matrix and can begin to familiarize themselves with the new system.
- You can now access Matrix and take a look around for yourself. Just go to http://matrix.onregional.ca to log in. When you sign in to Matrix, you will need to use your new username. Your Matrix username will consist of our association’s initials of “HB” (for “Hamilton-Burlington”) plus your current user ID. For example, if your user ID is SMITHJO, your username will be HBSMITHJO, and your password will be the password you use now to access Fusion.
- Listing data isn’t complete in Matrix; we will let you know when regular updates occur.
- Your contacts should now be available in Matrix. Please take some time to look them over for completeness, and update where needed.
- The parallel period for the Cambridge, Guelph and Kitchener Waterloo associations has been extended and the parallel period for the STARRS associations and the Oakville-Milton board will also be extended.
- The MLS® Rules have been approved by the Ontario Regional Technology and Information Systems (ORTIS) board of directors; the Rules will be reviewed by the RAHB Board at their meeting on September 10.
- RAHB has prepared a Transition to Matrix guide to help members prepare for Matrix. The guide includes step-by-step instructions on how to save your contacts and searches, set up your own identity, set up your team and much, much more. View the guide on REALTOR Link® or at rahb.ca/Matrix/transitionguide.pdf.
Some tips for using Matrix while in preview mode:
- Use the map search for best results.
- Listing data isn’t being updated regularly yet in Matrix, so new listings or those with status changes
may not be there or may be out of date.
- Continue to use Fusion for all your business as it has the most accurate data; use Matrix to get
accustomed to the new software.
RAHB has added the following Matrix training sessions for members:
Monday, September 14 – 2 p.m. – 4 p.m.
These will have similar content to the large CoreLogic sessions held August 25 and 26, but will be presented by RAHB staff at the RAHB office. This is lecture style instruction.
RAHB is offering the following Matrix training sessions for office administrators and admin assistants:
Wednesday, September 16, 5 p.m. – 7 p.m.
Monday, October 5, 9 a.m. – 11 a.m.
All sessions will be held at the RAHB office. For more info or to register, contact Camryn at camrynh@rahb.ca or 905.529.8101 x251.
Sep 9, 2015 | MLS®, Stats & Technology |
RAHB MLS® staff have received numerous calls regarding listings that are not appearing on REALTOR.ca.
If your listing does not appear on REALTOR.ca it is because the listing is not mapped in Fusion. If it is not mapped in Fusion, it will not be searchable by the address or the map on REALTOR.ca, which means it can only be found by the MLS® number.
CREA revised its criteria for uploading several months ago, and now requires that your listing include the Internet Ad Copy and the latitude and longitude coordinates that are automatically generated in Fusion when the property is mapped.
Whether you broker load your own listings or your office does them for you, it is imperative the property is mapped properly as soon as it is submitted in Fusion. If Fusion is not able to automatically map your property, you must map it manually by placing the house icon and car icon on the map. Be sure to click Save when you are done. This will automatically generate the latitude and longitude coordinates for upload to REALTOR.ca.
PLEASE NOTE: If your property is not mapped in Fusion when first submitted, the map location can be edited after the fact; however, you must modify the Internet Ad Copy and re-save the listing to force the listing to re-upload to REALTOR.ca with the map coordinates.
When we cut over to Matrix, the same criteria will apply – once your listing has been submitted, you will choose whether to map your property automatically, or manually plot it on the map.
Sep 9, 2015 | MLS®, Stats & Technology |
(September 3, 2015 – Hamilton, Ontario) The REALTORS® Association of Hamilton-Burlington (RAHB) reported 1,300 sales were processed through the RAHB Multiple Listing Service® (MLS®) System in August. Sales were 7.2 per cent higher than the same month last year and 12.4 per cent higher than the 10-year average.
There were 1,833 properties listed in August, an increase of 16.9 per cent compared to August of last year.
“Despite the increase in number of properties listed, end of month listing inventory was still 9.5 per cent lower than last year,” said RAHB CEO George O’Neill. “There is slightly over two and a half months of listing inventory – more than at the end of last month, but still low enough to leave our area in a seller’s market.”
Seasonally adjusted* sales of residential properties were 8.2 per cent higher than the same month of the previous year, with the average sale price up 16.7 per cent for the month. Seasonally adjusted numbers of new listings were 13.9 per cent higher than the same month the year prior.
Seasonally adjusted data for residential properties for the month of August, 2015:

Actual overall residential sales of 1,251 units were 7.9 per cent higher than the same month last year, and set a new record for sales in the month of August. Residential freehold sales were 8.1 per cent higher than last August while sales in the condominium market increased by 7.2 per cent.
The average price of freehold properties showed an increase of 19.4 per cent compared to the same month the previous year; the average sale price in the condominium market increased by 1.2 per cent when compared to the same period.
The average sale price is based on the total dollar volume of all properties sold by RAHB members. Average sale price information can be useful in establishing long term trends, but should not be used as an indicator that specific properties have increased or decreased in value.
“The increase in average sale price for residential properties overall and for freehold properties is a bit misleading,” noted O’Neill. “We report on all activity processed through our Multiple Listing Service®, and some of those properties are not located in our market area. As it happened this last month, there were a couple of very high end properties in Oakville which were listed by our members and which sold for around $10 million. Those kinds of numbers can really skew our statistics. Looking at the median sale price is more helpful – the median for all residential sales was $365,000 and $393,500 for freehold – a big difference from the average of $501,830 for freehold properties.”
“This is why it is important to consult with a REALTOR® when you are looking for information about the value of properties in any given area,” he added.
The average days on market decreased from 41 to 36 days in the freehold market and from 39 to 38 days in the condominium market when compared to the same month the previous year.
Year to date, sales are 11.6 per cent higher compared to the same period last year; listings are 7.2 per cent higher than last year and the average sale price is nine per cent higher for the period.

Every community in RAHB’s market area has its own localized residential market. Please refer to the accompanying chart for residential market activity in select areas in RAHB’s jurisdiction.

*Seasonal adjustment removes normal seasonal variations, enabling analysis of monthly changes and fundamental trends in the data.
Established in 1921, the REALTORS® Association of Hamilton-Burlington (RAHB) represents more than 2,700 real estate brokers and sales representatives from Hamilton, Burlington and outlying areas. Members of the association may use the REALTOR® trademark, which identifies them as real estate professionals who subscribe to a strict code of ethics. The association operates the local Multiple Listing Service® (MLS®) and provides ongoing professional education courses for its members. In addition, RAHB is an active participant in the Home Ownership Affordability Partnership (HOAP) and holds an annual auction in support of local charities. Advertisements of local MLS® property listings and information about the services provided by a REALTOR® can be found at www.REALTOR.ca. More information about RAHB is available at www.rahb.ca.
Sep 9, 2015 | MLS®, Stats & Technology |


