RAHB Sales – December 2015
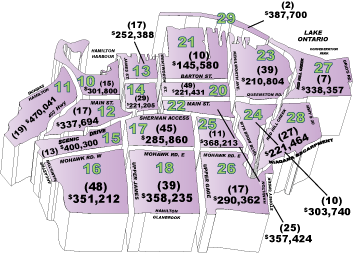
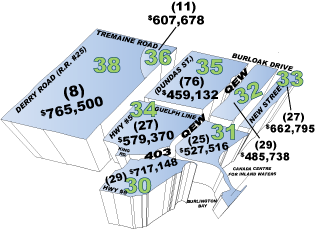
RAHB Average Price by District – (#) Residential Unit Sales
Hamilton
Hamilton West, 10 – 12
Hamilton East, 23, 24, 27 – 29
Hamilton Centre, 13, 14, 20 – 22
Hamilton Mountain, 15 – 18, 25 & 26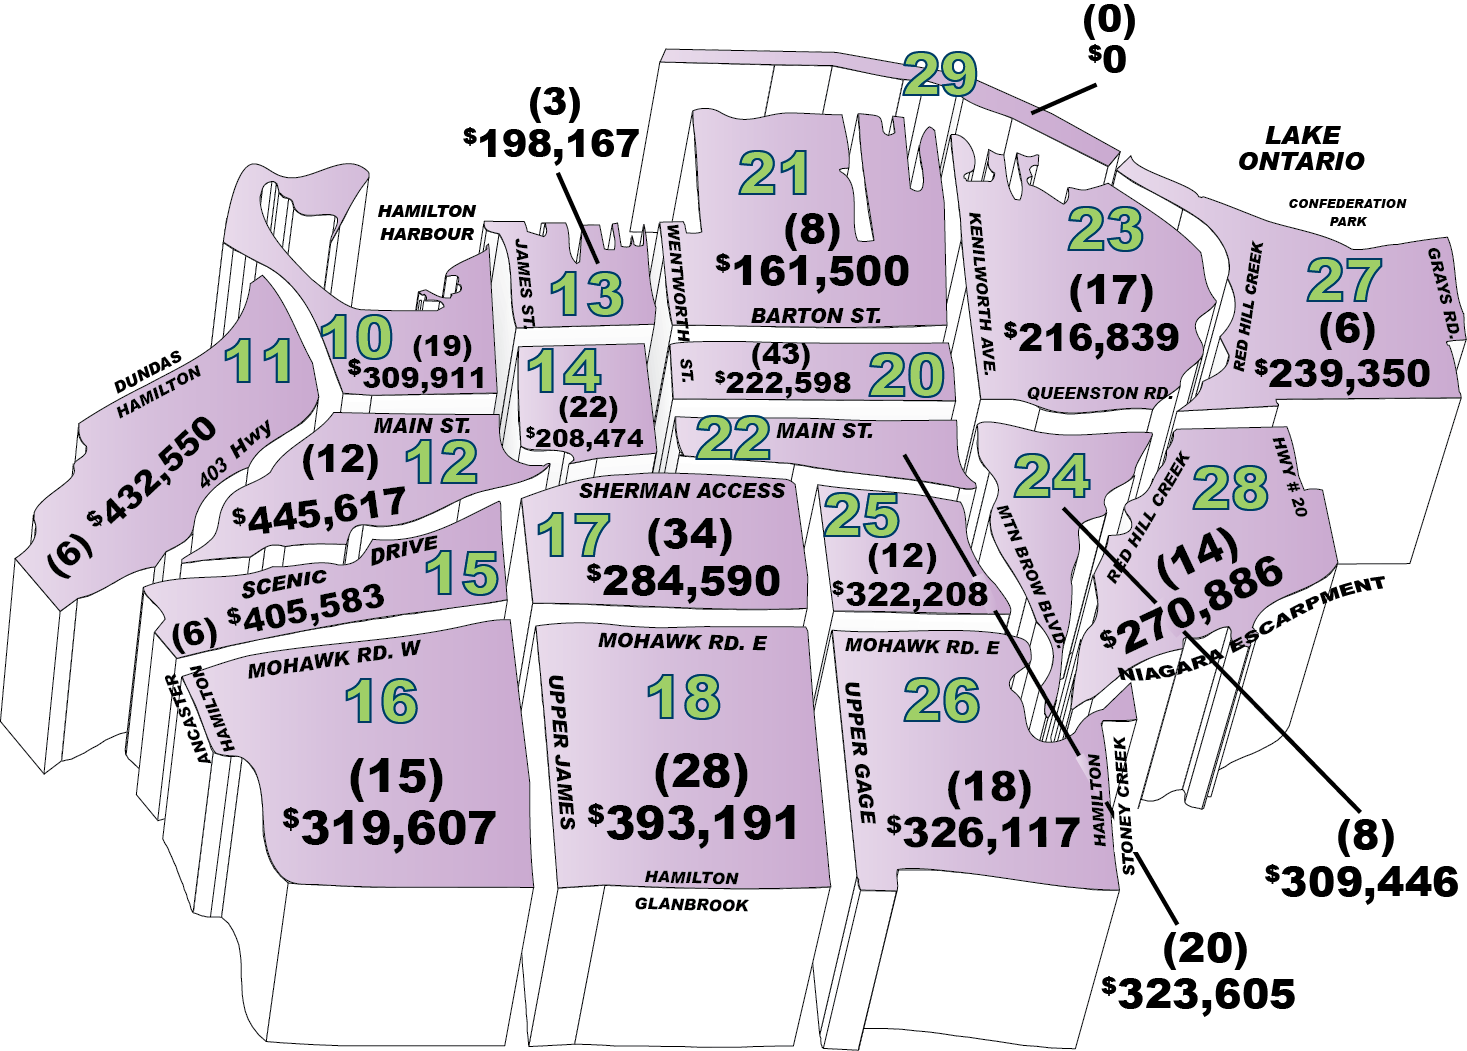
Burlington, 30 – 36, 38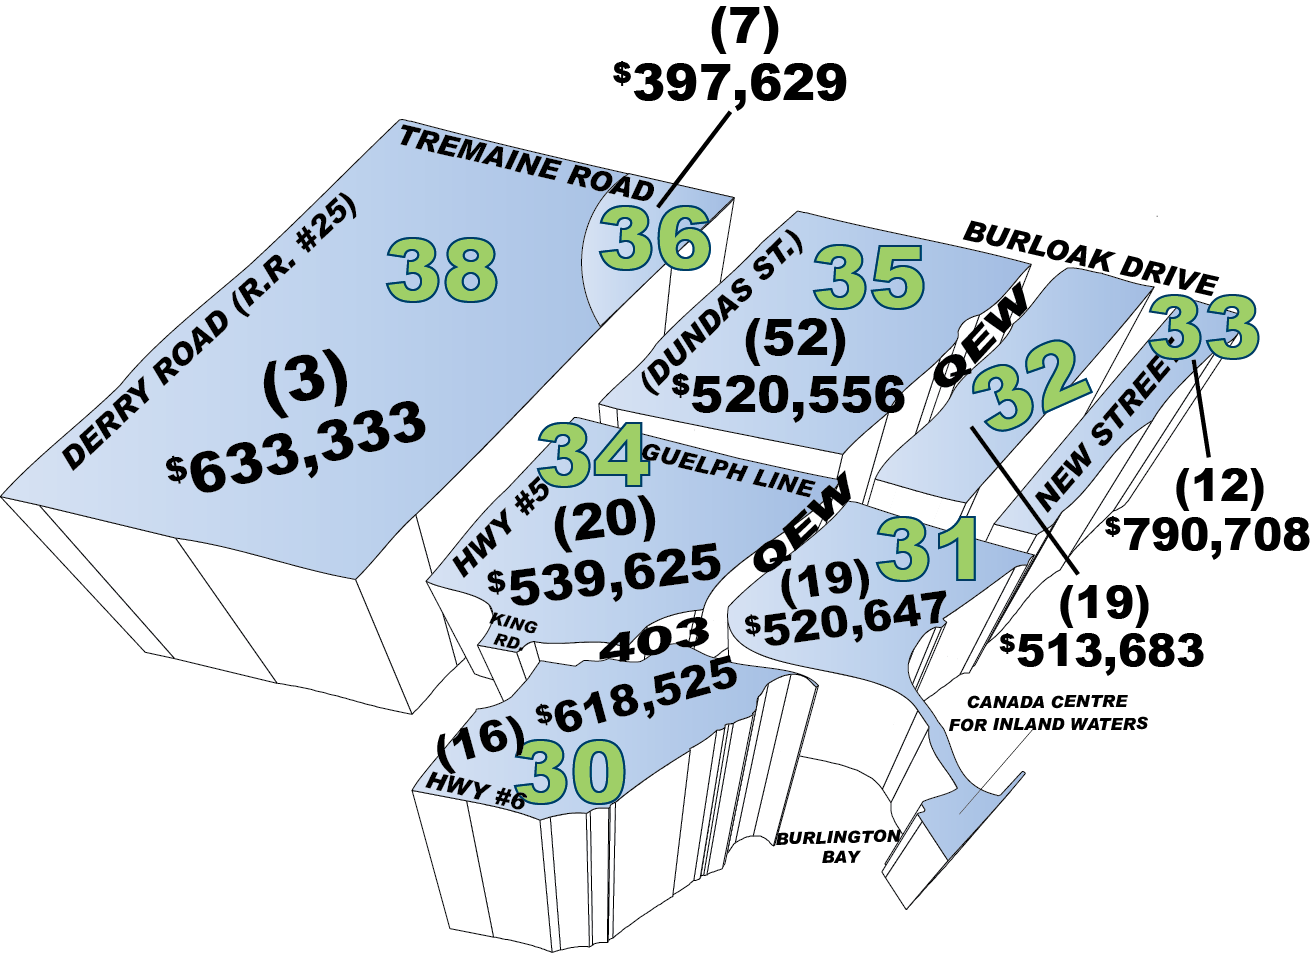
Outlying
Flamborough, 40, 43 – 45
Dundas, 41
Ancaster, 42
Waterdown, 46
Stoney Creek, 50 – 52
Glanbrook, 53
Grimsby, 54 -55
West Lincoln, 56
Smithville, 57
Dunnville, 61
Cayuga, 62
Calendonia/Hagersville, 63 & 70
Onieda/Seneca, 71 & 64
Rainham, 65
Canborough/Dunn, 60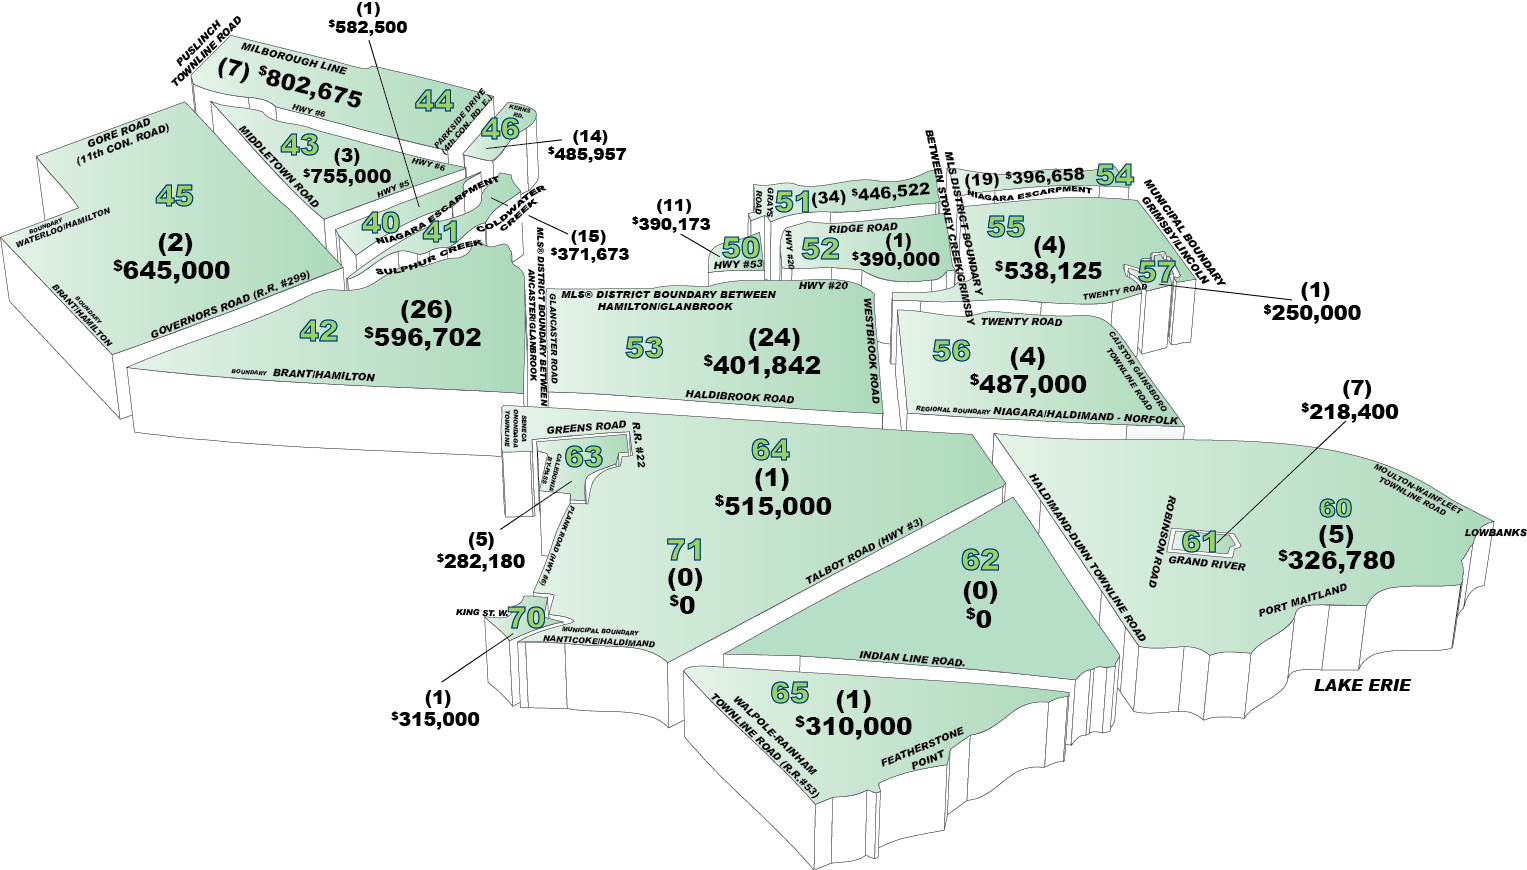
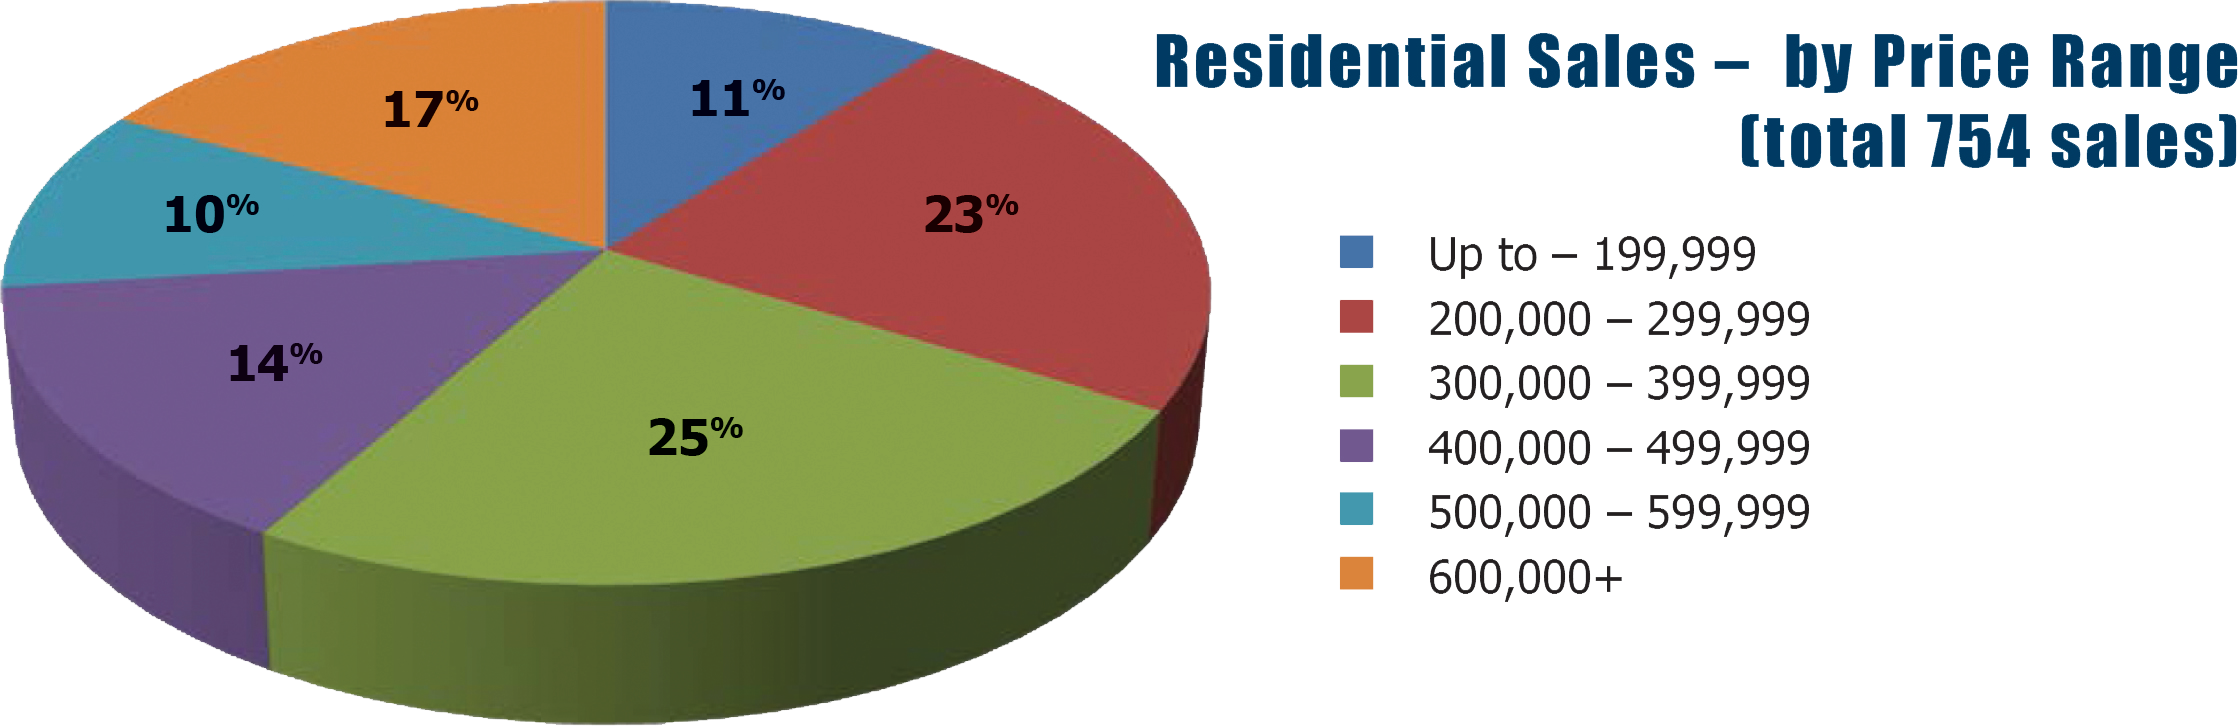
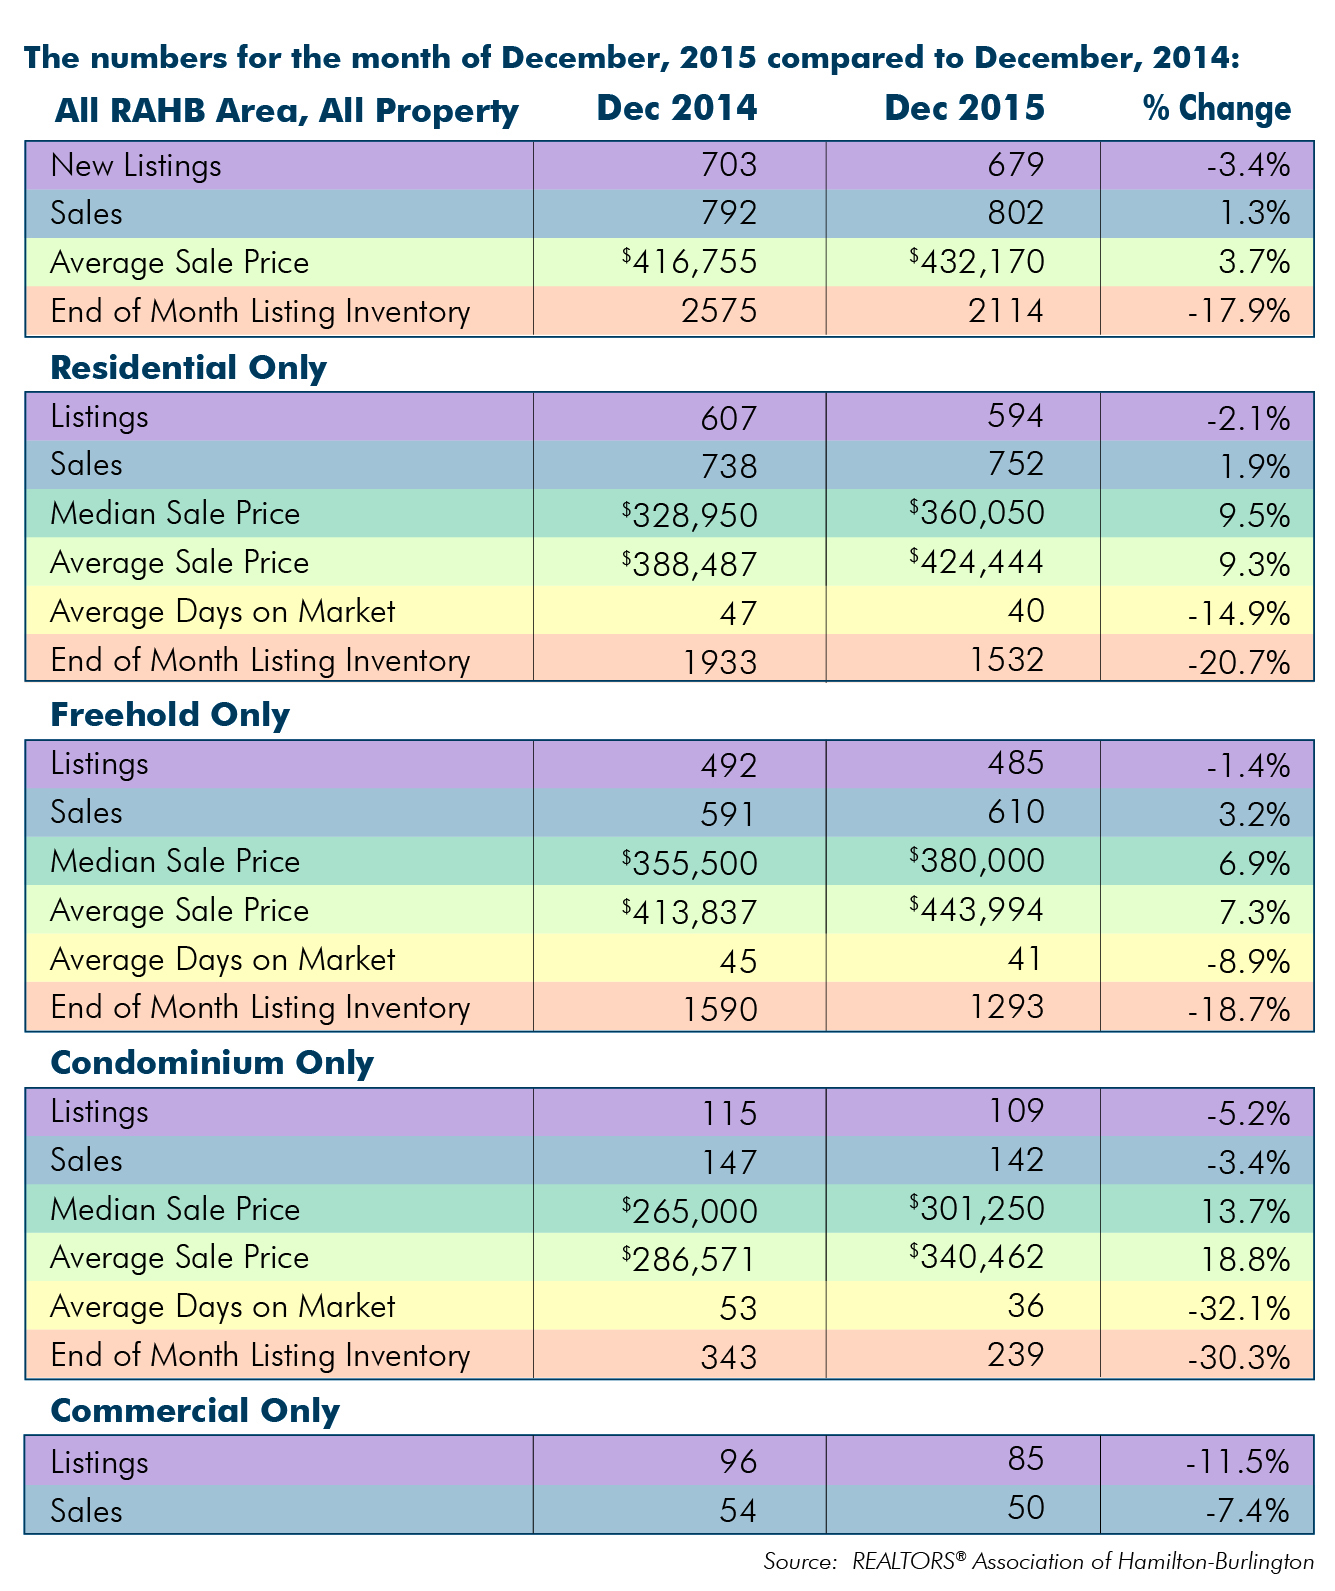
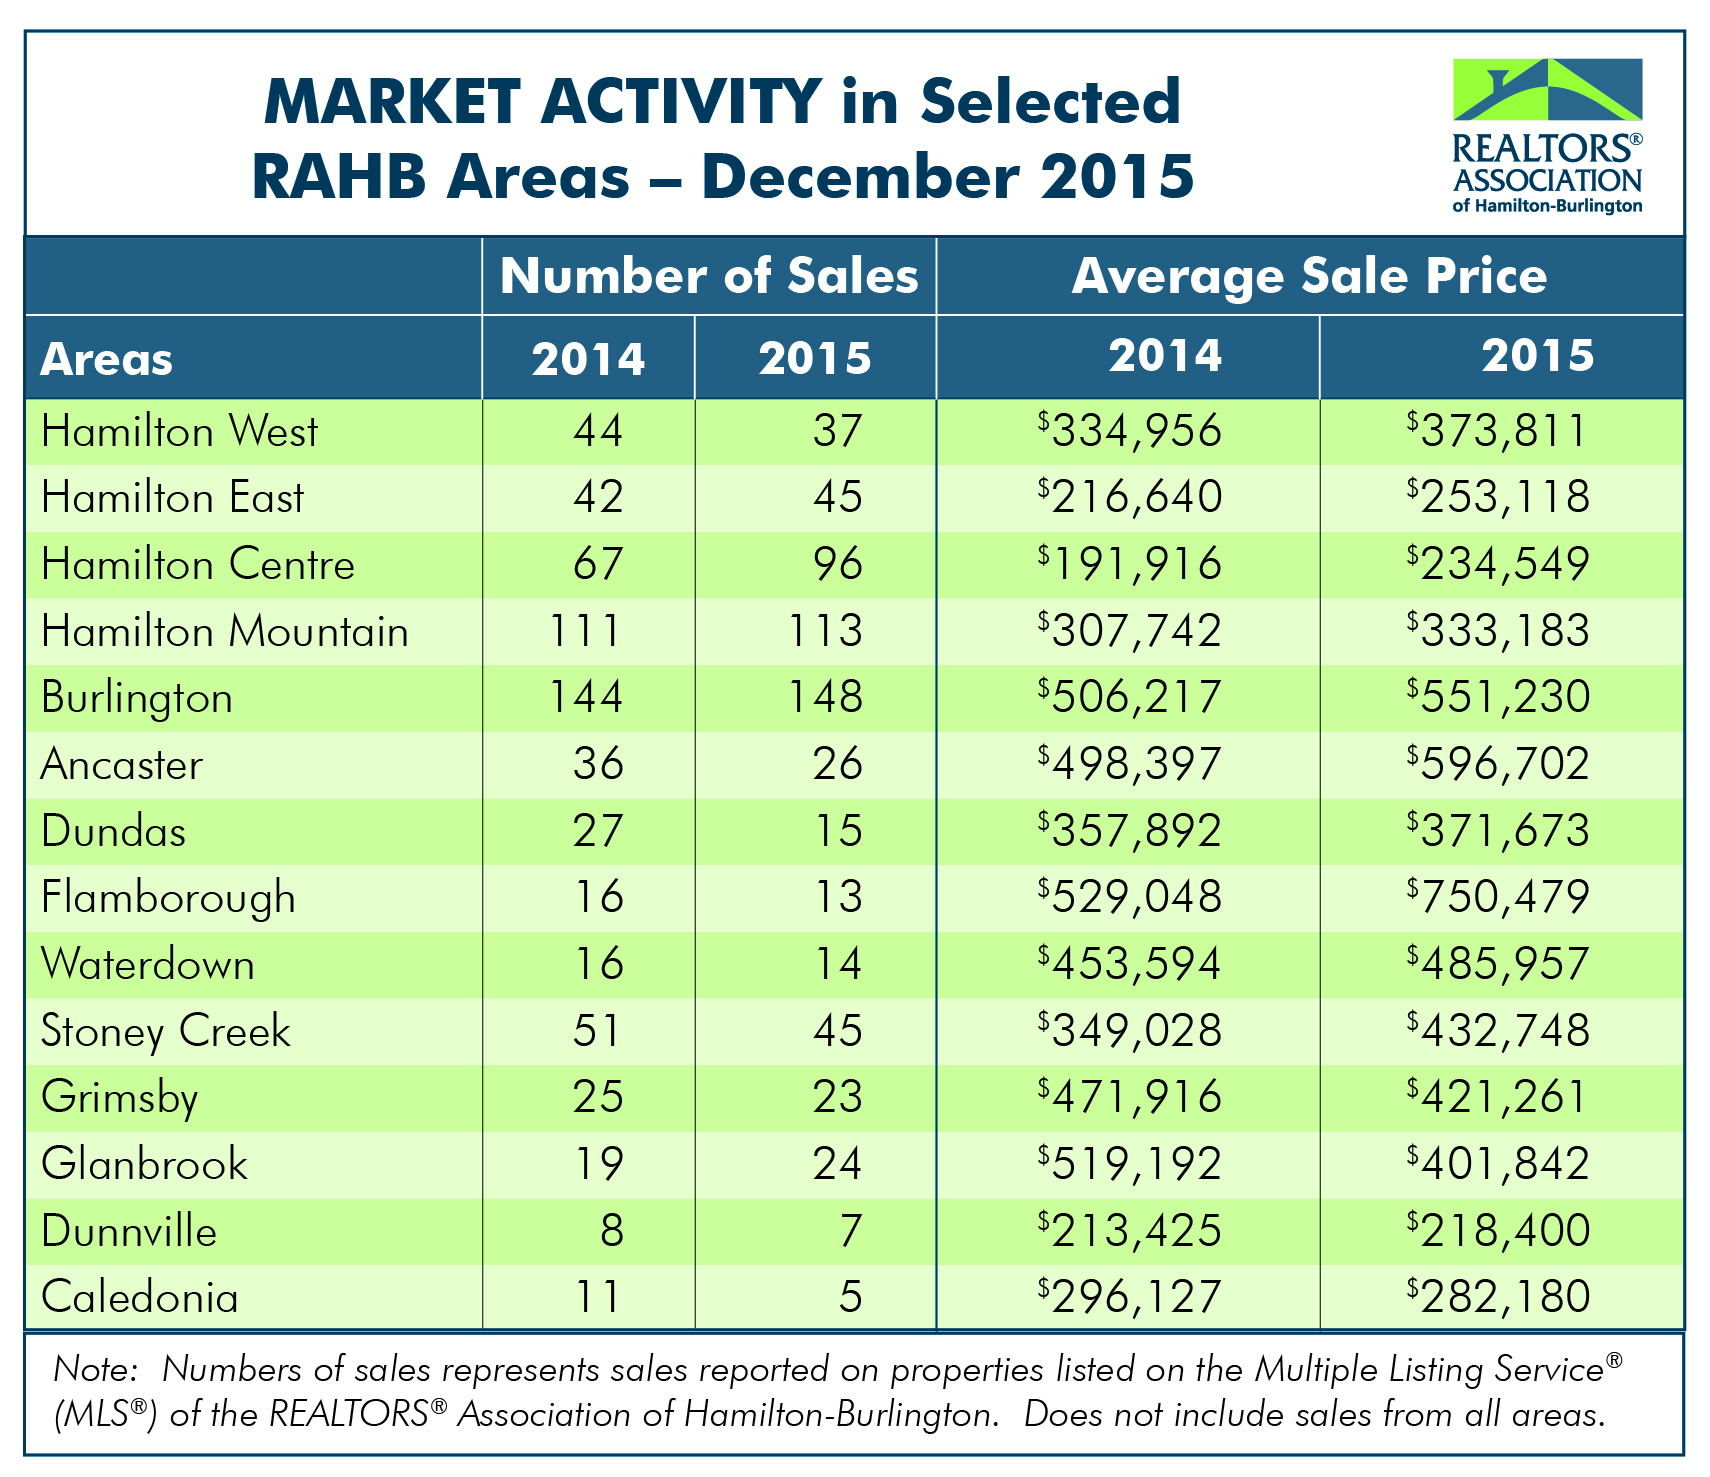
The REALTORS® Association of Hamilton-Burlington (RAHB) reported 802 sales were processed through the RAHB Multiple Listing Service® (MLS®) System in December of 2015. Sales were 1.3 per cent higher than the same month the previous year, 17.6 per cent higher than the 10-year average, and were a new record for the month of December. This is the fifth month in a row where the record for monthly sales has been broken.
“It has clearly been another exceptional month for real estate sales in the RAHB market area,” said RAHB CEO George O’Neill. “December sales are always among the lowest of the year because of the holidays and the weather, but this year’s sales were the highest ever for the month. It seems an appropriate way to end a year which saw so many previous sales records fall.”
There were 679 properties listed in December, a decrease of 3.4 per cent compared to December of the previous year.
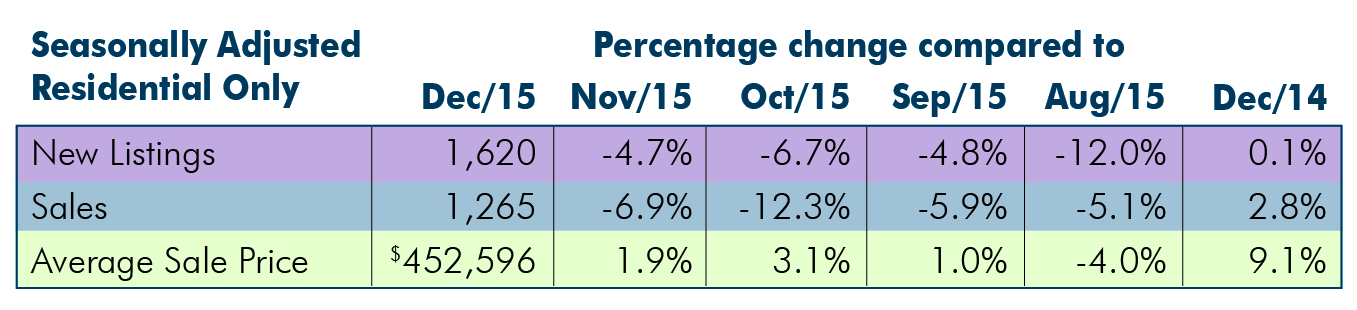
Seasonally adjusted* sales of residential properties were 2.8 per cent higher than the same month of the previous year, with the average sale price up 9.1 per cent for the month. Seasonally adjusted numbers of new listings were virtually the same as the same month the year before.
Seasonally adjusted data for residential properties for the month of December, 2015:
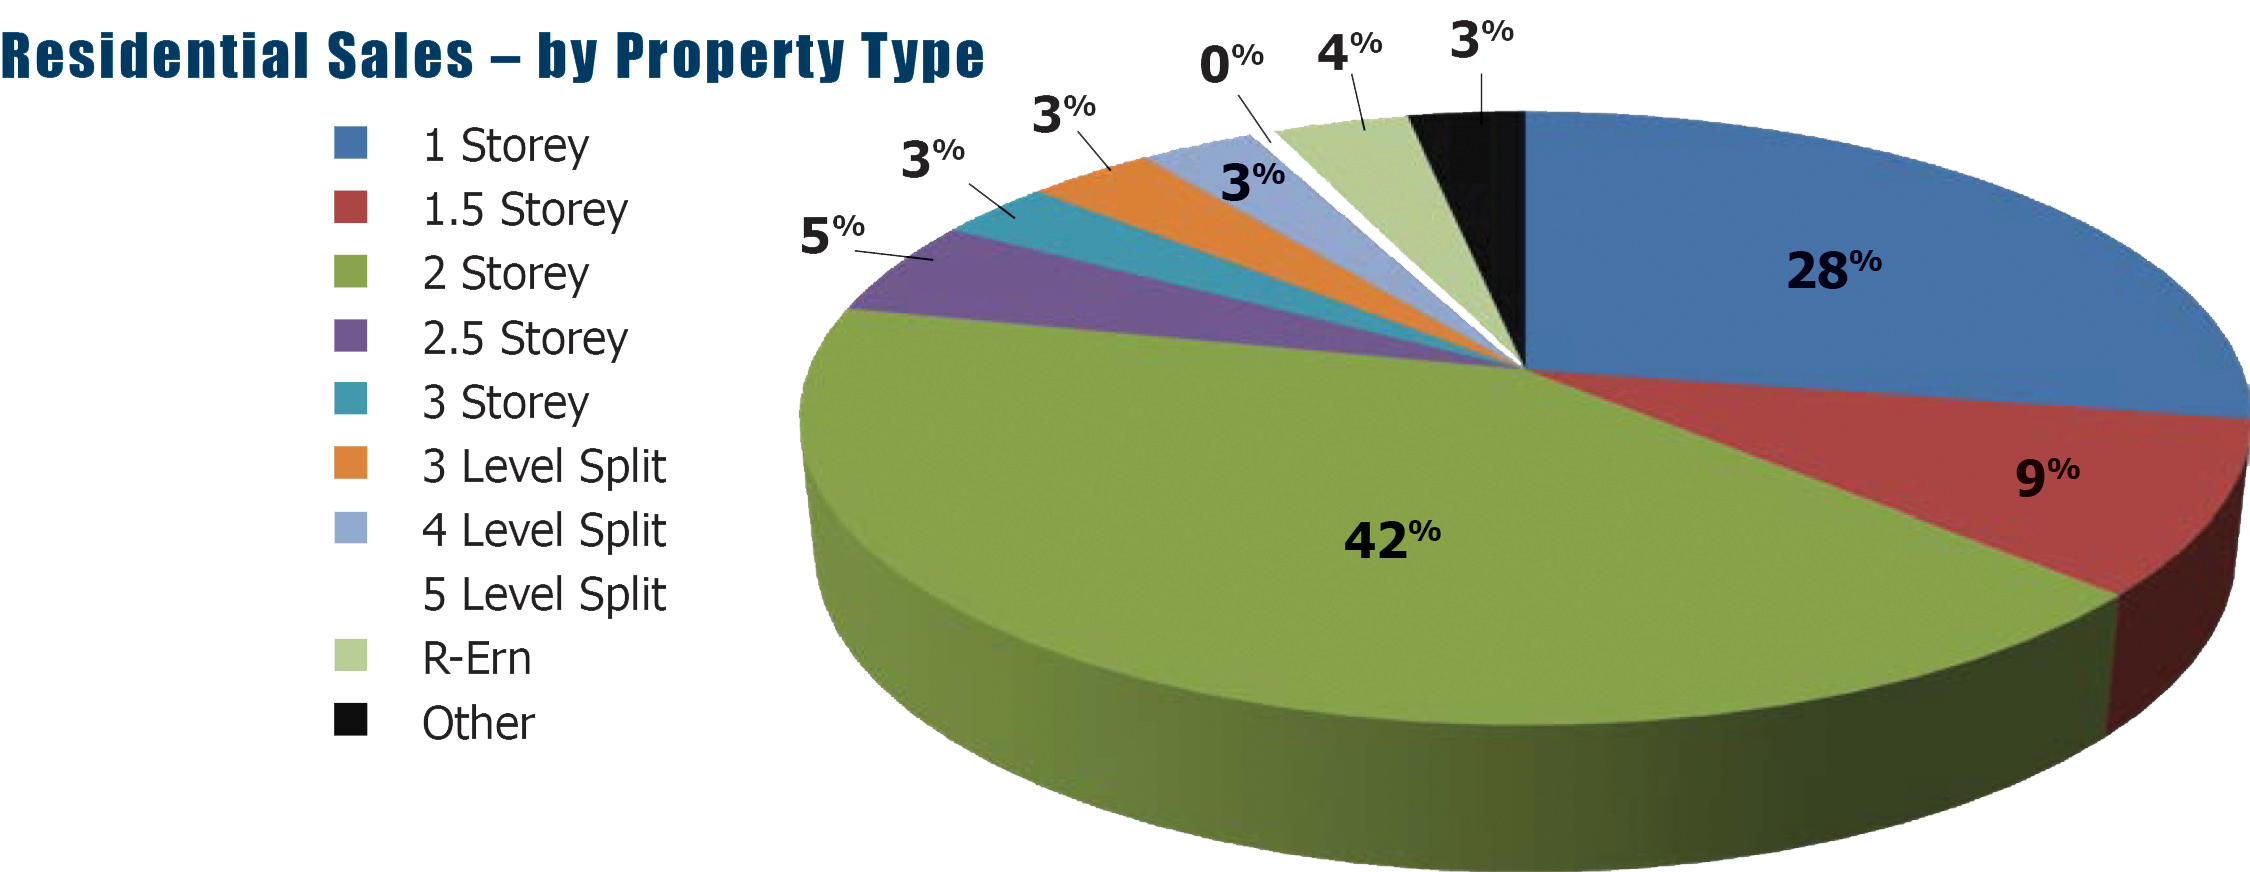
Actual overall residential sales of 752 units were 1.9 per cent higher than the same month the year previous. Residential freehold sales were 3.2 per cent higher than the previous December while sales in the condominium market decreased by 3.4 per cent.
The average price of freehold properties showed an increase of 7.3 per cent compared to the same month the previous year; the average sale price in the condominium market increased by 18.8 per cent when compared to the same period.
The average sale price is based on the total dollar volume of all properties sold by RAHB members. Average sale price information can be useful in establishing long term trends, but should not be used as an indicator that specific properties have increased or decreased in value. Contact a REALTOR® for information about your area or property.
The average days on market decreased from 45 to 41 days in the freehold market and from 53 to 36 days in the condominium market when compared to the same month the previous year.
Every community in RAHB’s market area has its own localized residential market. Please refer to the accompanying chart.
*Seasonal adjustment removes normal seasonal variations, enabling analysis of monthly changes and fundamental trends in the data.
Established in 1921, the REALTORS® Association of Hamilton-Burlington (RAHB) represents more than 2,800 real estate brokers and sales representatives from Hamilton, Burlington and outlying areas. Members of the association may use the REALTOR® trademark, which identifies them as real estate professionals who subscribe to a strict code of ethics. The association operates the local Multiple Listing Service® (MLS®) and provides ongoing professional education courses for its members. In addition, RAHB is an active participant in the Home Ownership Affordability Partnership (HOAP) and holds an annual auction in support of local charities. Advertisements of local MLS® property listings and information about the services provided by a REALTOR® can be found at www.REALTOR.ca. More information about RAHB is available at www.rahb.ca.
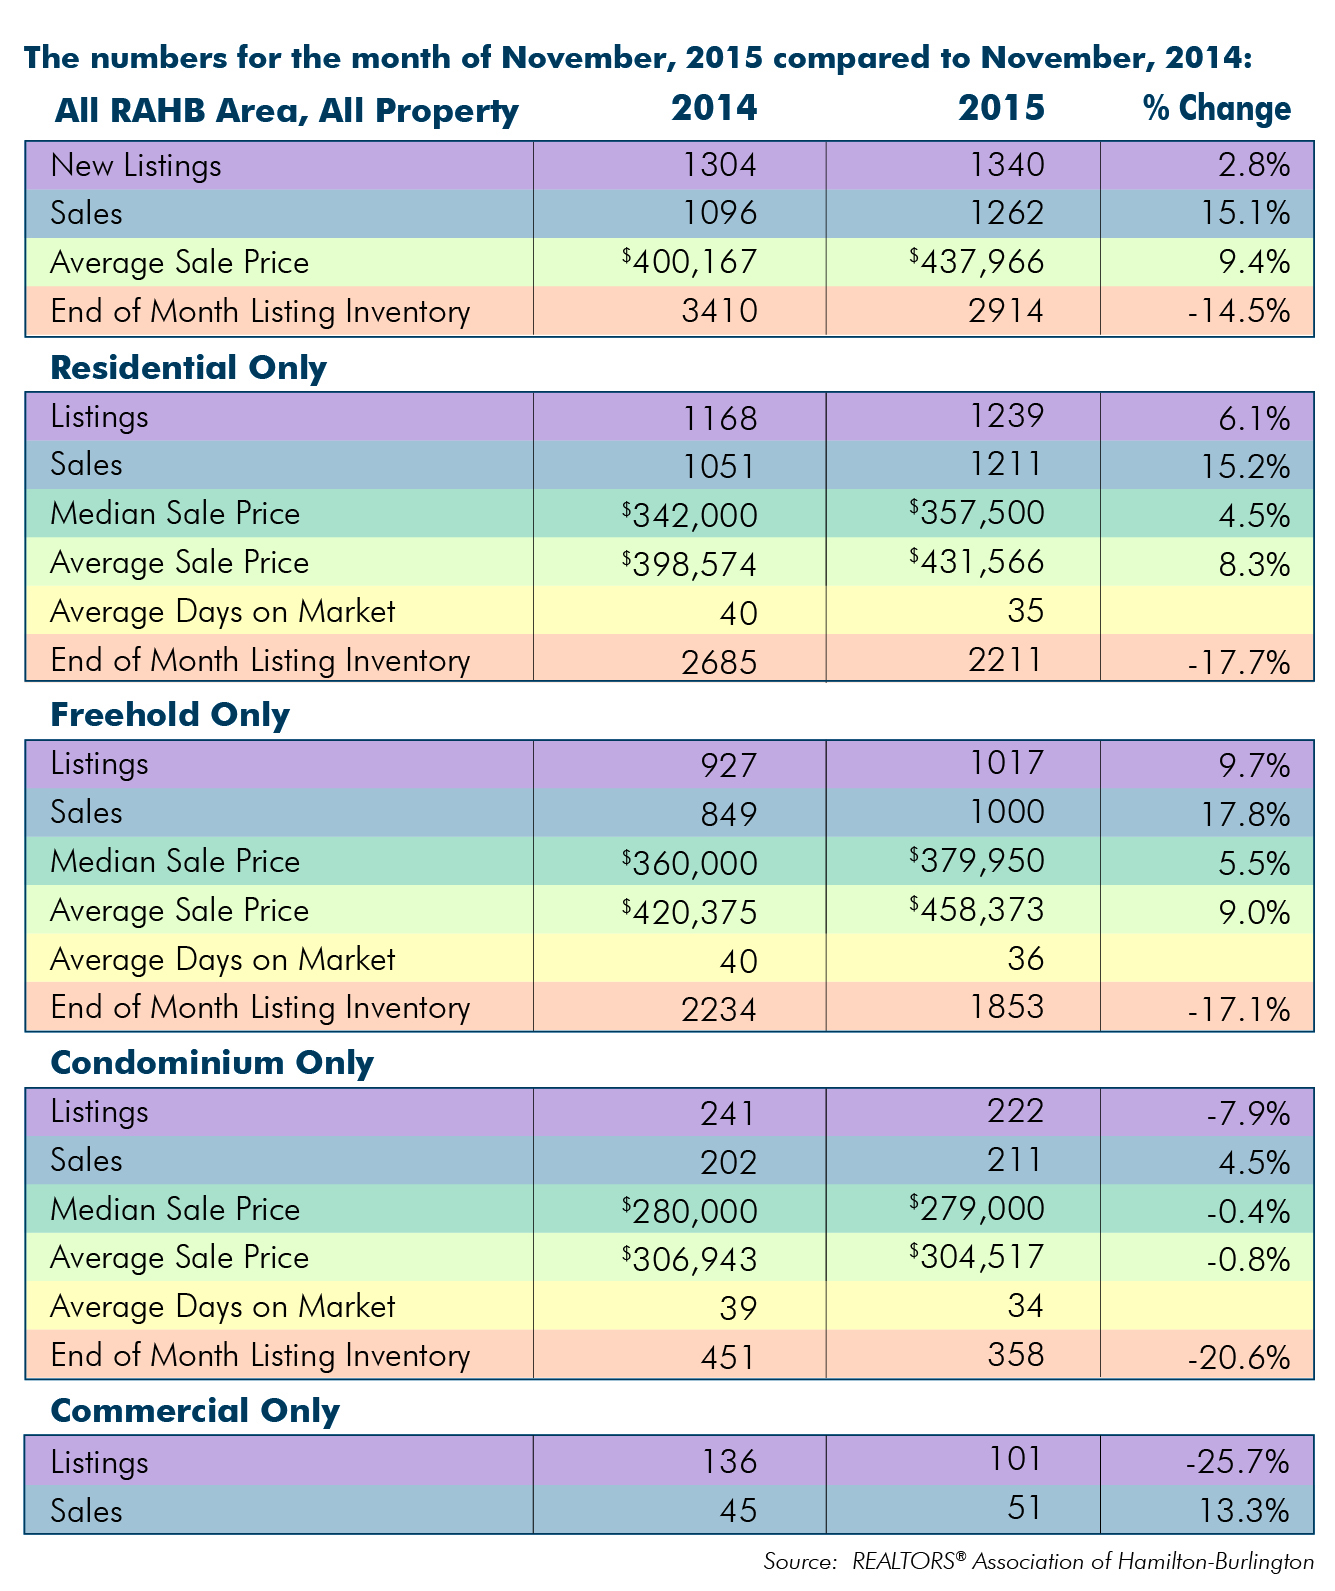
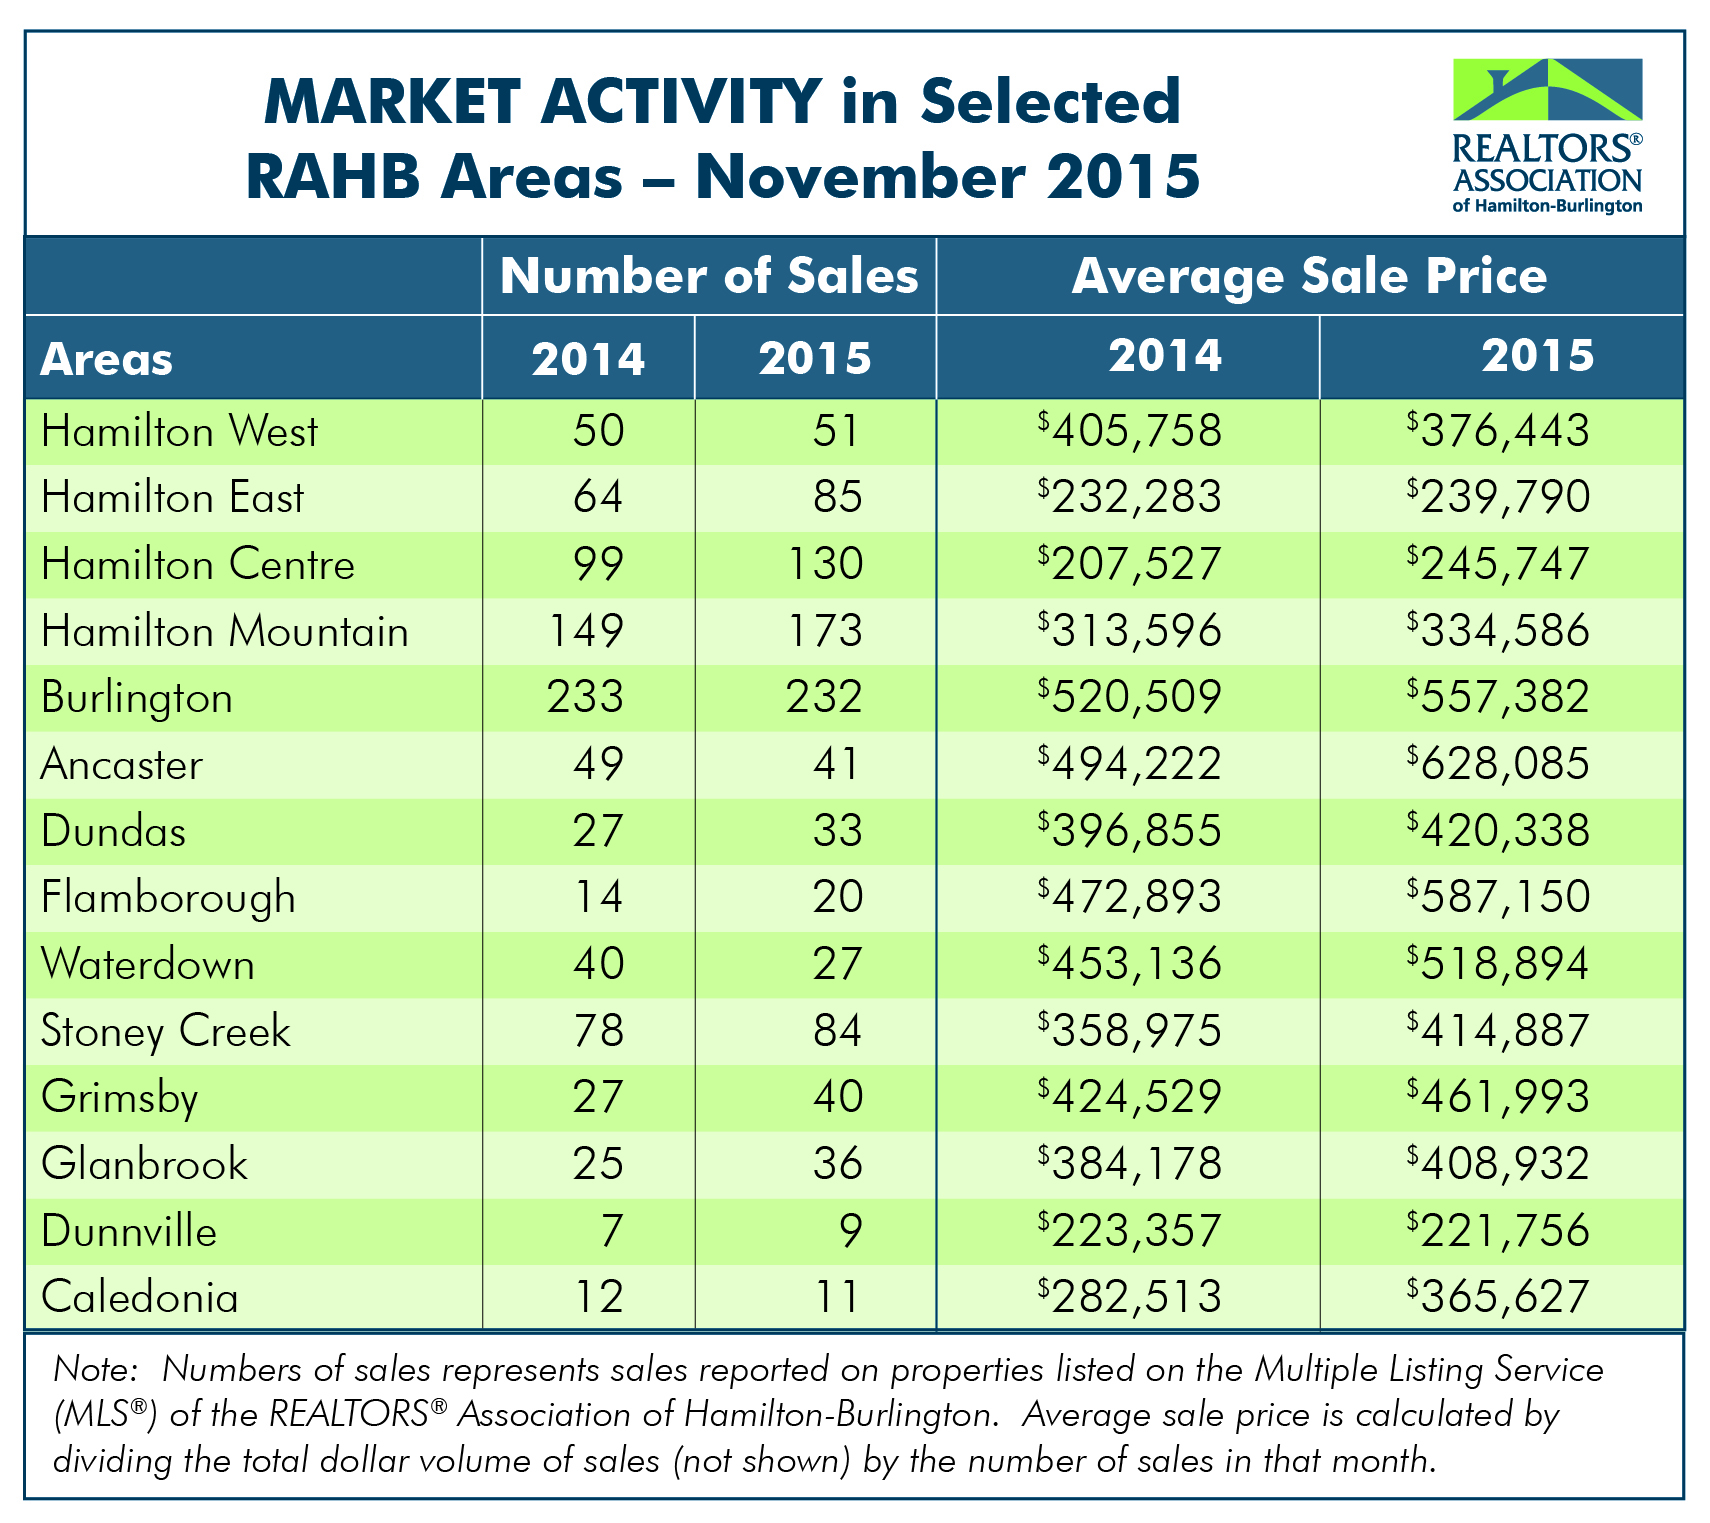
(December 3, 2015 – Hamilton, Ontario) The REALTORS® Association of Hamilton-Burlington (RAHB) reported 1,262 sales were processed through the RAHB Multiple Listing Service® (MLS®) System in November. Sales were 15.1 per cent higher than the same month last year, 23.8 per cent higher than the 10-year average, and were a record for the month of November. This is the fourth month in a row where records for monthly sales have been broken.
There were 1,340 properties listed in November, an increase of 2.8 per cent compared to November of last year.
“Low inventory and a record number of sales for the month is a recipe for a continued seller’s market,” said RAHB CEO George O’Neill. “With only a little over two months of inventory, and a high sales to new listings ratio, we are continuing in the seller’s market that has persisted in our area .”
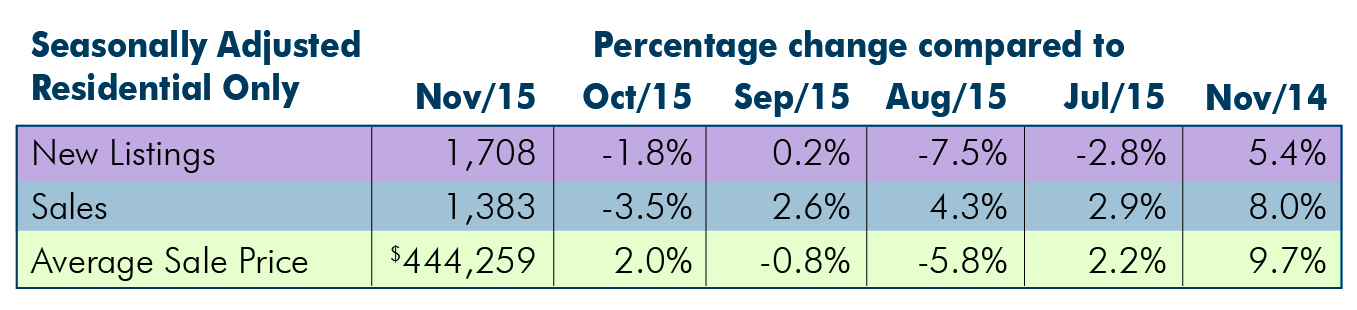
Seasonally adjusted* sales of residential properties were 18.9 per cent higher than the same month of the previous year, with the average sale price up 6.8 per cent for the month. Seasonally adjusted numbers of new listings were 1.7 per cent higher than the same month the year prior.
Seasonally adjusted data for residential properties for the month of November, 2015:
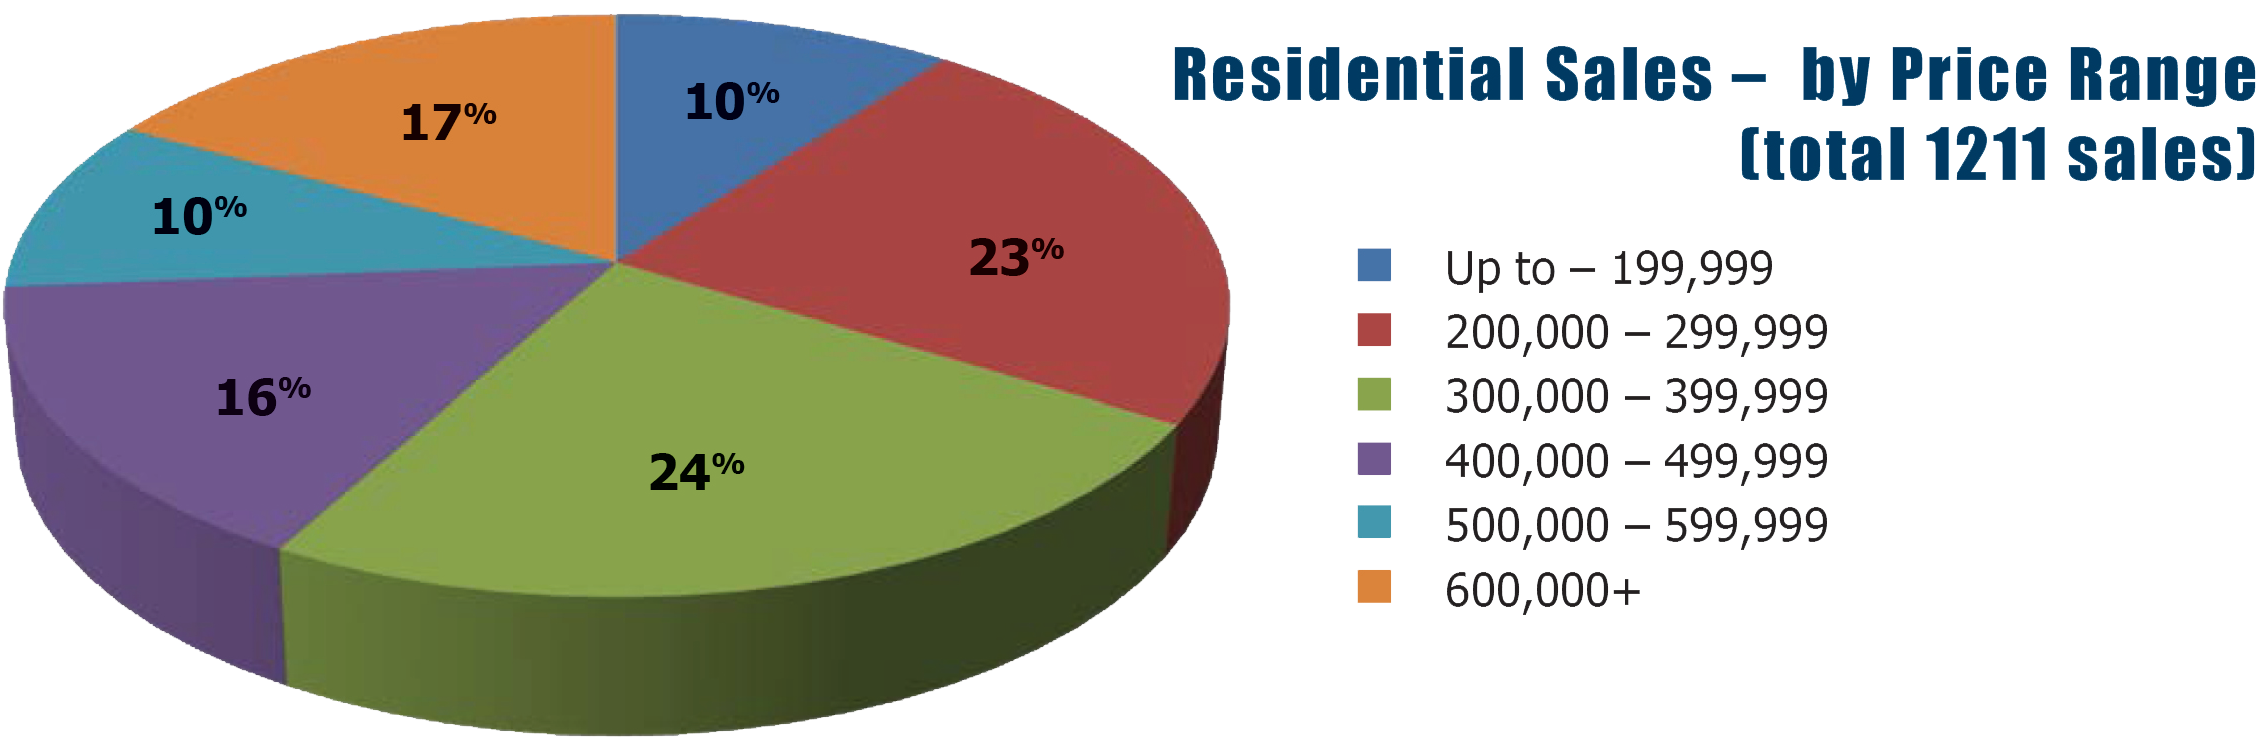
Actual overall residential sales of 1,211 units were 15.2 per cent higher than the same month last year. Residential freehold sales were 17.8 per cent higher than last November while sales in the condominium market increased by 4.5 per cent.
The average price of freehold properties showed an increase of nine per cent compared to the same month the previous year; the average sale price in the condominium market decreased by 0.8 per cent when compared to the same period.
The average sale price is based on the total dollar volume of all properties sold by RAHB members. Average sale price information can be useful in establishing long term trends, but should not be used as an indicator that specific properties have increased or decreased in value.
“It’s interesting to note,” added O’Neill. “that while the overall average sale price is almost ten per cent higher than last year at this time, it has actually been fairly level since February. There’s been a little up and down movement in average price, but mostly within a $10,000 range, with the exception of August when we saw the highest average sale price for this year.”
The average days on market decreased from 40 to 36 days in the freehold market and from 39 to 34 days in the condominium market when compared to the same month the previous year.
Year to date, sales are 11.5 per cent higher compared to the same period last year; listings are 6.1 per cent higher than last year and the average sale price is 8.5 per cent higher for the period.
Every community in RAHB’s market area has its own localized residential market. Please refer to the accompanying chart for residential market activity in select areas in RAHB’s jurisdiction.
*Seasonal adjustment removes normal seasonal variations, enabling analysis of monthly changes and fundamental trends in the data.
Established in 1921, the REALTORS® Association of Hamilton-Burlington (RAHB) represents more than 2,900 real estate brokers and sales representatives from Hamilton, Burlington and outlying areas. Members of the association may use the REALTOR® trademark, which identifies them as real estate professionals who subscribe to a strict code of ethics. The association operates the local Multiple Listing Service® (MLS®) and provides ongoing professional education courses for its members. In addition, RAHB is an active participant in the Home Ownership Affordability Partnership (HOAP) and holds an annual auction in support of local charities. Advertisements of local MLS® property listings and information about the services provided by a REALTOR® can be found at www.REALTOR.ca. More information about RAHB is available at www.rahb.ca.
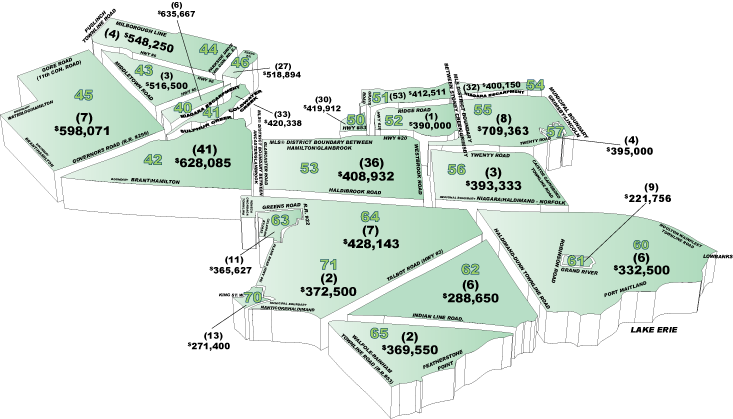
RAHB Average Price by District – (#) Residential Unit Sales
Hamilton
Hamilton West, 10 – 12
Hamilton East, 23, 24, 27 – 29
Hamilton Centre, 13, 14, 20 – 22
Hamilton Mountain, 15 – 18, 25 & 26
Burlington, 30 – 36, 38
Outlying
Flamborough, 40, 43 – 45
Dundas, 41
Ancaster, 42
Waterdown, 46
Stoney Creek, 50 – 52
Glanbrook, 53
Grimsby, 54 -55
West Lincoln, 56
Smithville, 57
Dunnville, 61
Cayuga, 62
Calendonia/Hagersville, 63 & 70
Onieda/Seneca, 71 & 64
Rainham, 65
Canborough/Dunn, 60
When you are reporting a sale or lease in Fusion and the selling agent is not a full RAHB member, please make sure you follow the steps outlined in RAHB’s MLS® policies, below.
SALES
When broker loading any sales where the selling salesperson is a non‐board broker, members will be required under Selling Agent 1 Code field to enter “NONMEM” and on the comment line “SOLD BY (NAME OF SELLING SALESPERSON) – (NAME OF SELLING BROKERAGE)”.
When you are reporting a lease, remember that:
Leases reported for the sold sheets must be on a per unit basis so that the listing and the lease price are reported in the same units. i.e., list price = $14.00 per square foot; lease price = $12.00 per square foot; the comments line of the sold sheet will give the breakdown and total volume for the lease.
*Note: Where the lease rate is on a per-month basis, you will enter the terms of the lease and the lease total in the “Selling Comments” field.
For example: the property leased for $1400/month and will be leased
for 1 year.
Enter: Leased for 1 yr @ $1400/month = $16,800
**Note: When the lease rate on a commercial listing is on a per-square foot basis, you will enter the terms of the lease and the lease total in the “Selling Comments” field.
For example: a 2000 square foot property is leased for $10/sqft for 1 year.
Enter: Leased 2000 sqft for 1 yr @ $10/sqft = $20,000. If the lease is for longer than one year and the lease rate will be adjusted each year, the breakdown will need to be entered.
As always, if you have any questions regarding reporting sales or leases, please call the MLS® Department at 905.667-.4650.
Matrix compiles data from eight associations participating in the regional MLS® system. Therefore, to provide consistency in Matrix for all users, there will be terms and definitions in Matrix that are not consistent with Fusion – that’s just part of the system and part of the learning curve for you.
One of the changes is to the status of Sold. This category is divided into two sections in Matrix.
Sold Pending will be the status for all properties where a sale or lease has been reported but has not yet closed.
Sold Closed will be the status for all properties where a sale or lease has been reported and the closing date has passed.
Until we cut over to Matrix, however, the status of Sold will continue as it is in Fusion.
The Board of Directors recently approved a change to the policy requiring mandatory training for broker loading.
Effective immediately, mandatory training is no longer required before broker load privileges can be extended to members, office administrators and administrative assistants. Brokers of Record/Managers now need only complete the Broker Load Permission Form to authorize members in their office, office administrators and administrative assistants to broker load. The form must be completed in full and returned to the MLS® department (attention Pam Morton).
The form is available on REALTOR Link® under the Member Services tab. For more information, contact the MLS® department or Corporate Services department.
Are you missing the membership changes that used to appear on the last page of now defunct RAHB topsheets?
Miss them no more. All membership changes – additions, deletions, transfers, brokerage updates and obituaries – are now compiled and uploaded daily to REALTOR Link®. They appear on the Member Services tab, near the bottom of the page.
All commercial listings, formerly displayed on ICX.ca, have found their permanent home in the new commercial section on REALTOR.ca.
For your commercial clients, access to all listing types on one site will offer not only a more user-friendly experience, but greatly enhanced visibility for commercial searches.
Key benefits of adding commercial listings to REALTOR.ca:
What does this mean?
REALTOR.ca now has two tabs for easy toggling from Commercial to Residential. The Commercial tab gives your commercial clients the ability to search for and view all commercial listings and the Residential tab allows your residential clients to search for and view residential listings along with all multi-family properties, some of which have previously only been available on ICX.ca.
Anyone who searches for ICX.ca or have it bookmarked in their browser will be automatically directed to the Commercial section of REALTOR.ca.
REALTOR.ca is now a one-stop shop for all your clients’ real estate needs.
(From CREA’s NEWS2Me blog)
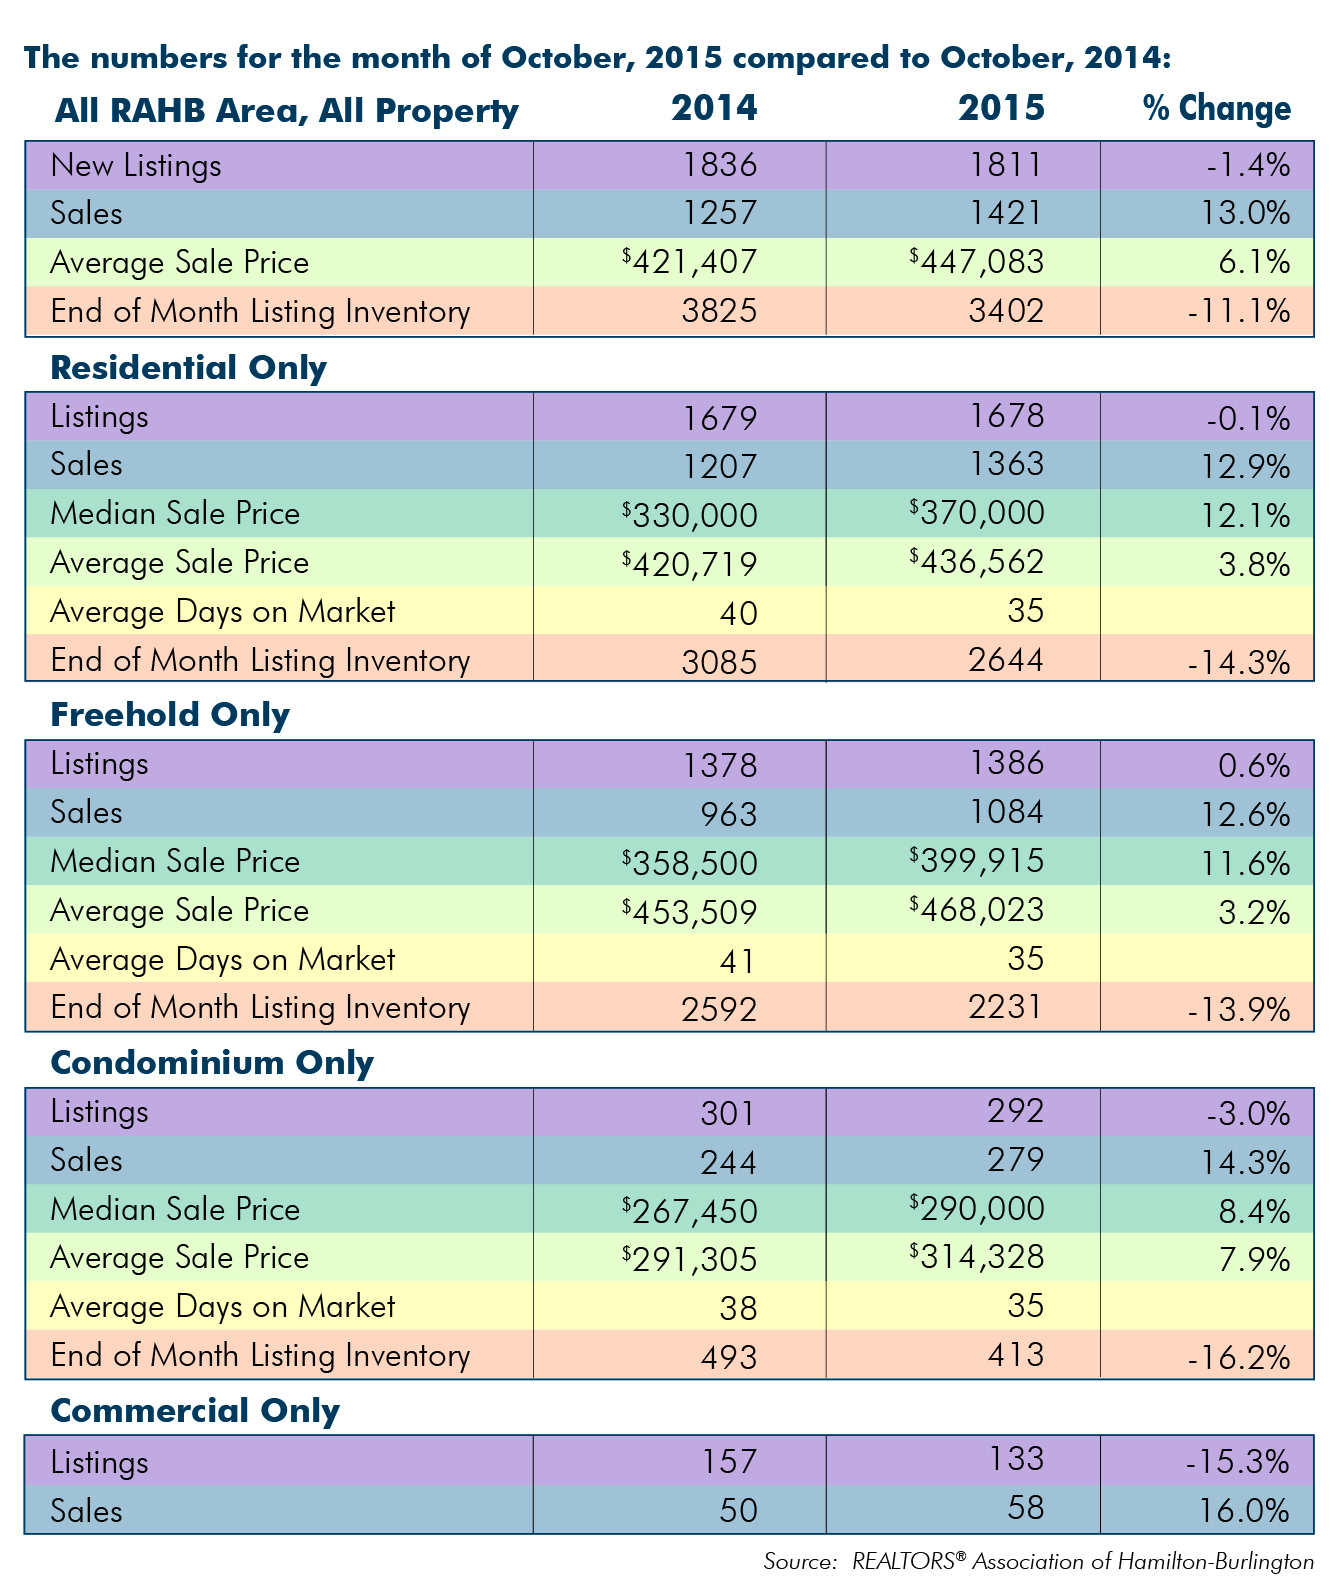
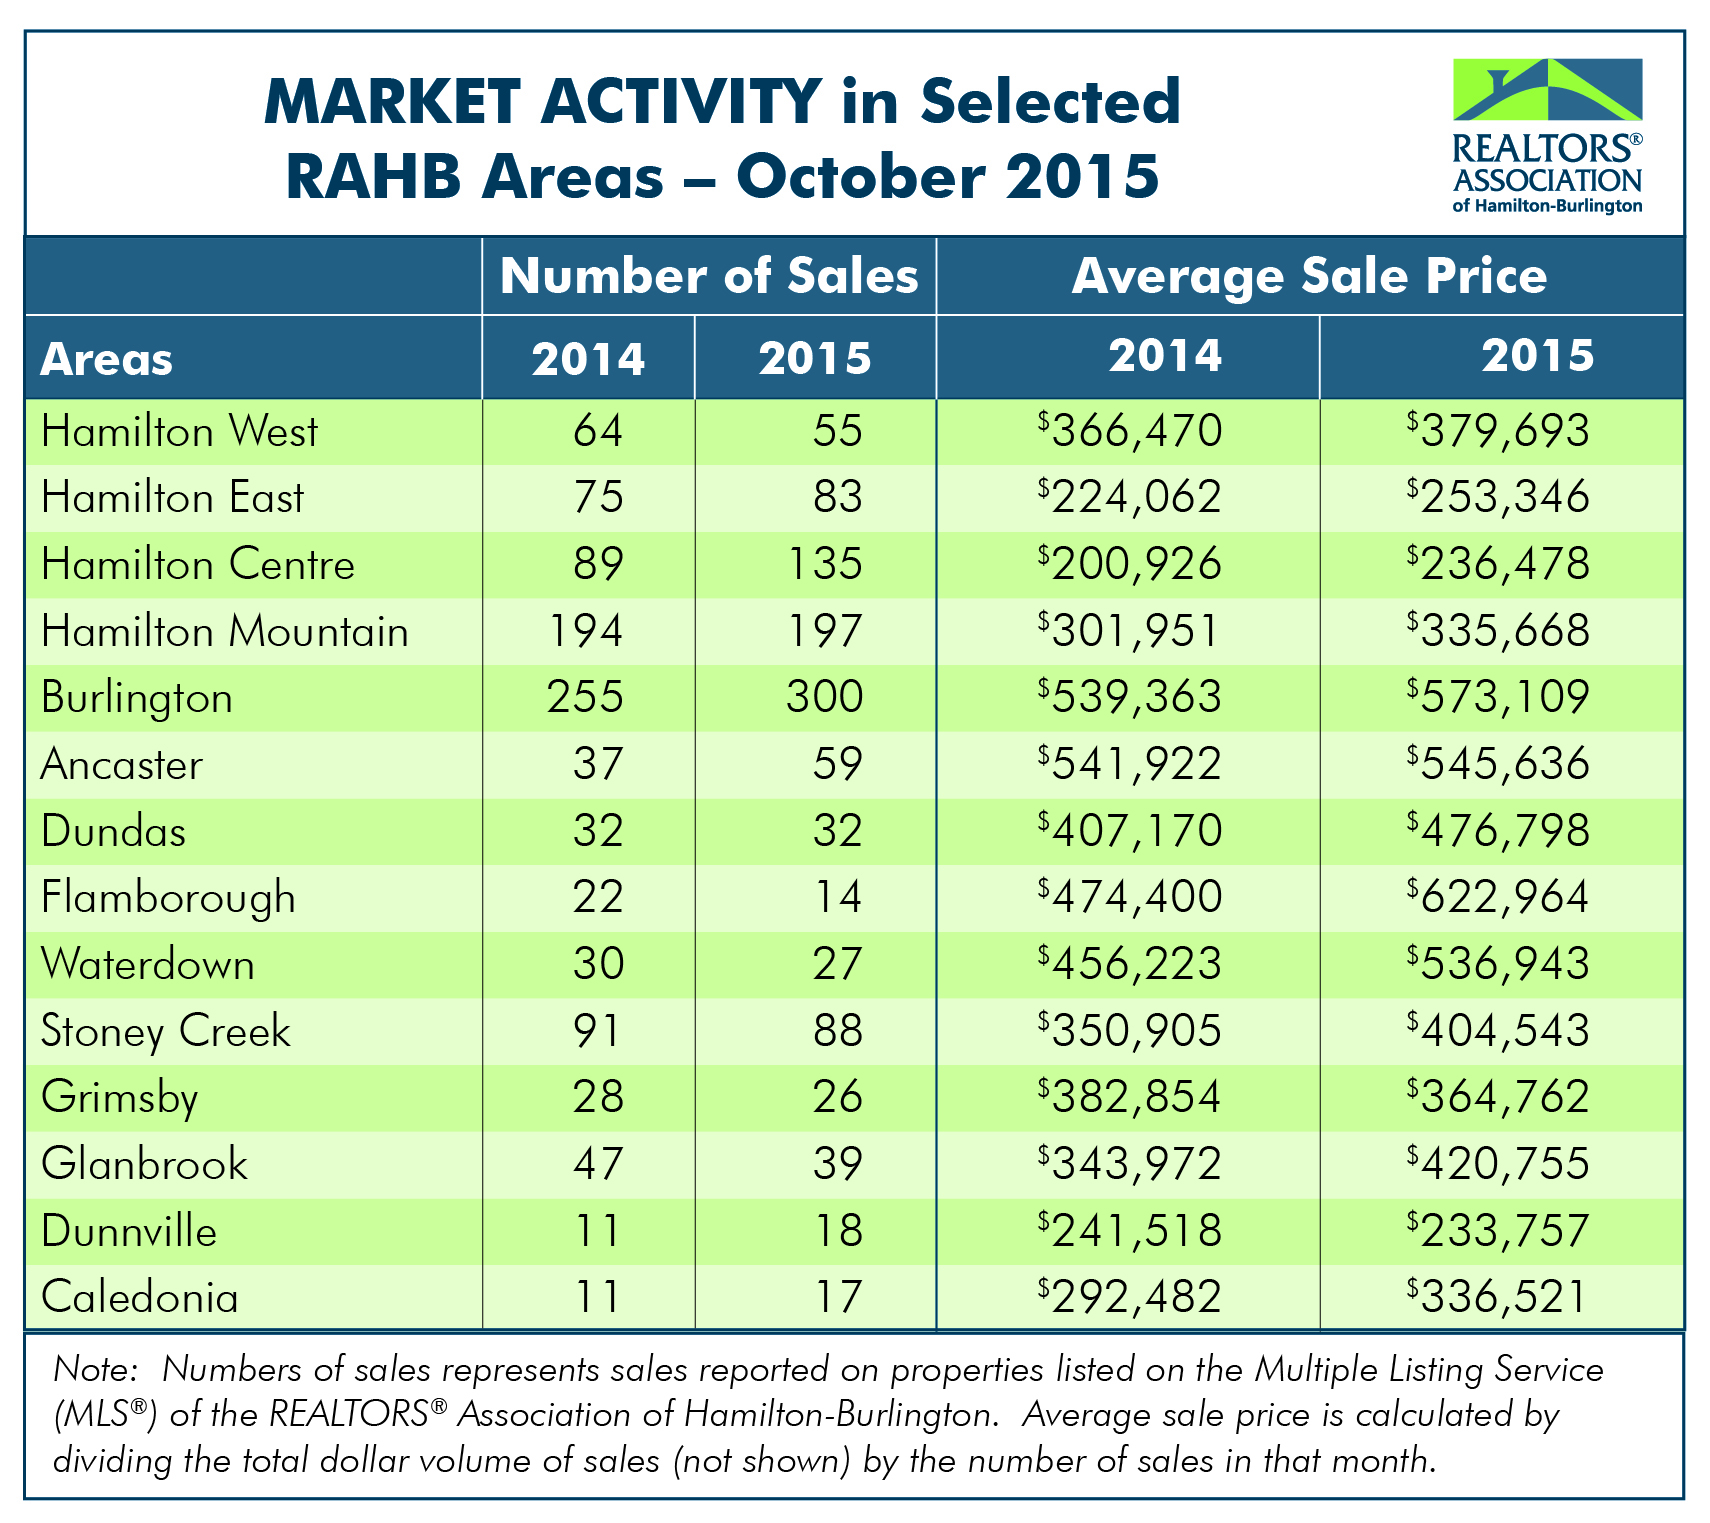
(November 5, 2015 – Hamilton, Ontario) The REALTORS® Association of Hamilton-Burlington (RAHB) reported 1,421 sales were processed through the RAHB Multiple Listing Service® (MLS®) System in October. Sales were 13 per cent higher than the same month last year, 25.8 per cent higher than the 10-year average, and were a record for the month of October. This is the third month in a row where records for monthly sales have been broken.
There were 1,811 properties listed in October, a decrease of 1.4 per cent compared to October of last year.
“The Fall real estate market just keeps going in our area,” said RAHB CEO George O’Neill. “October is often a good month for sales, but it’s not usually this good.”
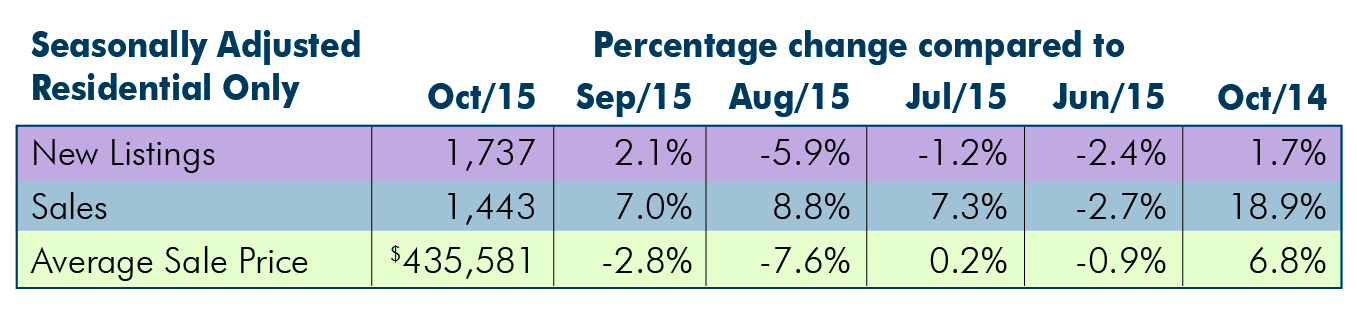
Seasonally adjusted* sales of residential properties were 18.9 per cent higher than the same month of the previous year, with the average sale price up 6.8 per cent for the month. Seasonally adjusted numbers of new listings were 1.7 per cent higher than the same month the year prior.
Seasonally adjusted data for residential properties for the month of October, 2015:
Actual overall residential sales of 1,363 units were 12.9 per cent higher than the same month last year. Residential freehold sales were 12.6 per cent higher than last October while sales in the condominium market increased by 14.3 per cent.
The average price of freehold properties showed an increase of 9.3 per cent compared to the same month the previous year; the average sale price in the condominium market increased by 5.7 per cent when compared to the same period.
The average sale price is based on the total dollar volume of all properties sold by RAHB members. Average sale price information can be useful in establishing long term trends, but should not be used as an indicator that specific properties have increased or decreased in value.
“Listing inventory is still down across the board,” noted O’Neill. “Our sales-to-listings ratio is still firmly in the seller’s market range in the residential market. Inventory in the condominium market is particularly tight, with only a month and half’s inventory left.”
The average days on market decreased from 41 to 35 days in the freehold market and from 38 to 35 days in the condominium market when compared to the same month the previous year.
Year to date, sales are 11.3 per cent higher compared to the same period last year; listings are 6.2 per cent higher than last year and the average sale price is 8.4 per cent higher for the period.
Every community in RAHB’s market area has its own localized residential market. Please refer to the accompanying chart for residential market activity in select areas in RAHB’s jurisdiction.
*Seasonal adjustment removes normal seasonal variations, enabling analysis of monthly changes and fundamental trends in the data.
Established in 1921, the REALTORS® Association of Hamilton-Burlington (RAHB) represents more than 2,900 real estate brokers and sales representatives from Hamilton, Burlington and outlying areas. Members of the association may use the REALTOR® trademark, which identifies them as real estate professionals who subscribe to a strict code of ethics. The association operates the local Multiple Listing Service® (MLS®) and provides ongoing professional education courses for its members. In addition, RAHB is an active participant in the Home Ownership Affordability Partnership (HOAP) and holds an annual auction in support of local charities. Advertisements of local MLS® property listings and information about the services provided by a REALTOR® can be found at www.REALTOR.ca. More information about RAHB is available at www.rahb.ca.