Nov 8, 2016 | MLS®, Stats & Technology |
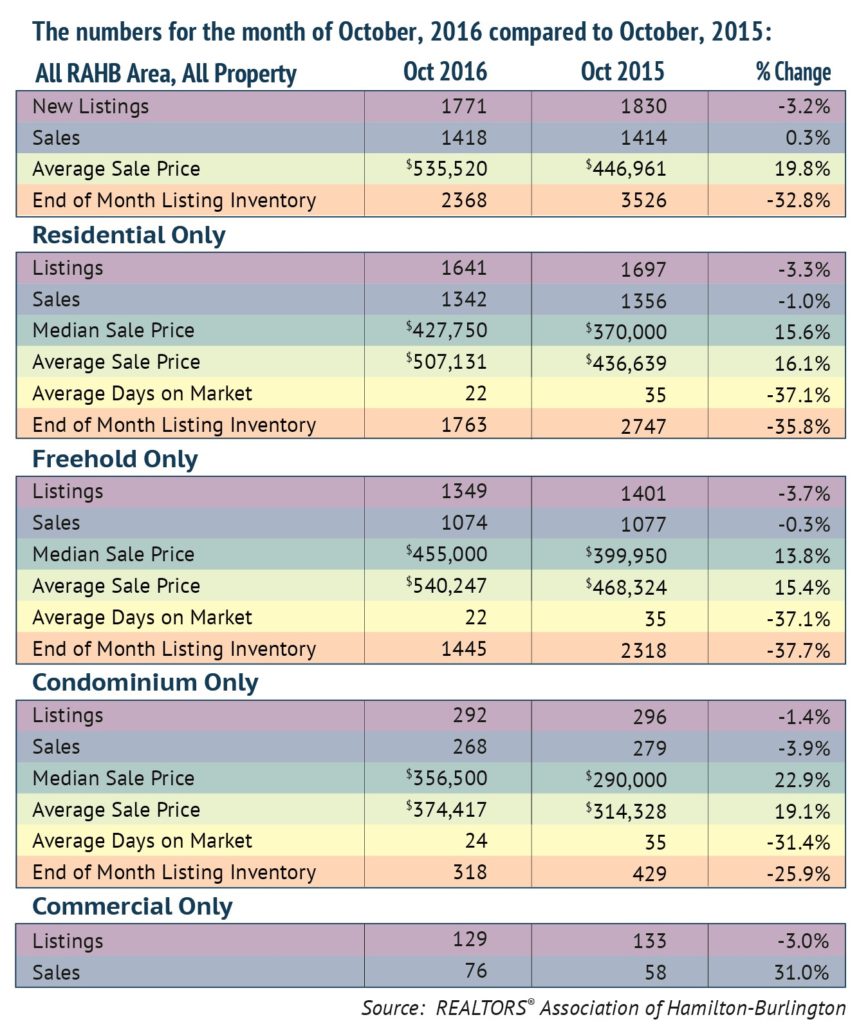
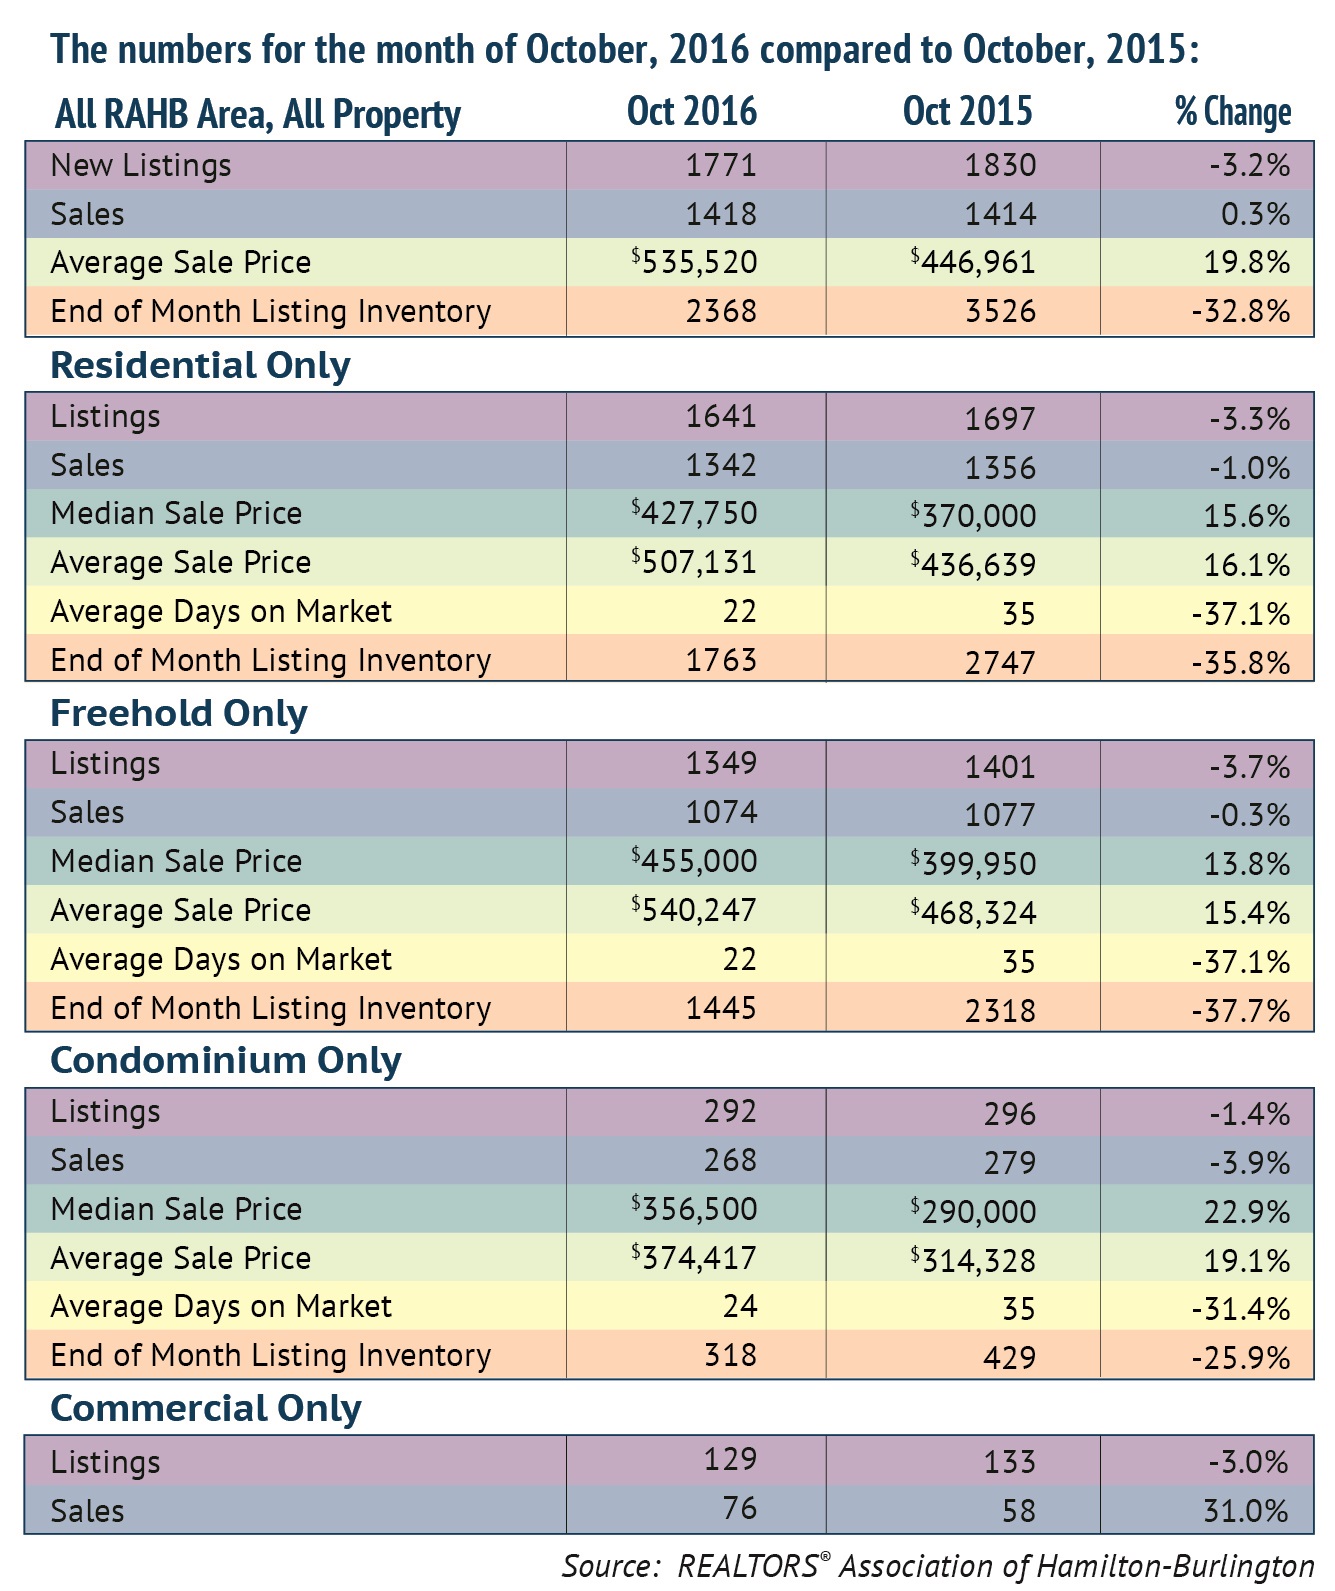
The REALTORS® Association of Hamilton-Burlington (RAHB) reported 1,418 sales were processed through the RAHB Multiple Listing Service® (MLS®) System in October. Sales were 0.3 per cent higher than the same month last year, and broke the monthly sales record for October, set just last year.
There were 1,771 properties listed in October, a decrease of 3.2 per cent compared to October of last year.
“Sales are still strong as we move into Fall,” said RAHB CEO George O’Neill. “October’s sales were 22 per cent higher than the 10-year average, while new listings were only 1.6 per cent above the average. We are continuing to experience the low inventory that has characterized the market all year, with the end-of-month listing inventory only about a third of what it was last year at this time.”
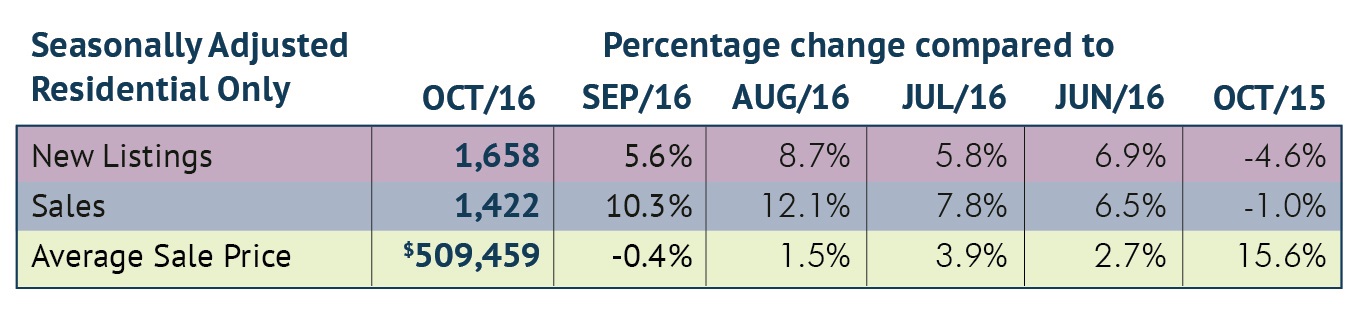
Seasonally adjusted* sales of residential properties were one per cent lower than the same month last year, with the average sale price up 15.6 per cent for the month. Seasonally adjusted numbers of new listings were 4.6 per cent lower than October of 2015.
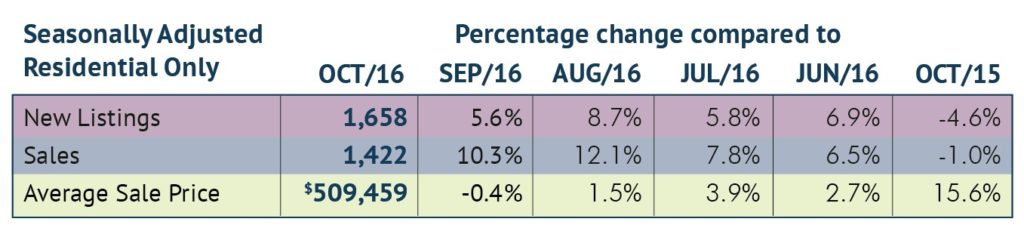
Overall residential sales of 1,342 units were one per cent lower than the same month last year. Residential freehold sales were 0.3 per cent lower than October of 2015 while sales in the condominium market were 3.9 per cent lower than the same month last year.
The median price of freehold properties increased by 13.8 per cent over the same month last year while the median price for condominium properties increased by 22.9 per cent compared to the same period.
The average price of freehold properties showed an increase of 15.4 per cent compared to October of last year; the average sale price in the condominium market increased by 19.1 per cent when compared to the same period.
Average sale price is based on the total dollar volume of all properties sold through the RAHB MLS® System. Average sale price can be useful in establishing long-term trends, but should not be used as an indicator that specific properties have increased or decreased in value. Contact a REALTOR® for information about your area or property.
The average number of days on market decreased from 35 to 22 days in the freehold market and from 35 to 24 days in the condominium market, compared to October of last year.
“The shorter time listings are on the market shows there are still plenty of buyers who are interested in owning property in the Greater Hamilton-Burlington area,” noted RAHB President Kim Alvarez. “It’s not a surprise, as this area has lots to offer – buyers from the area want to stay and buyers from outside the area are recognizing its charms.”
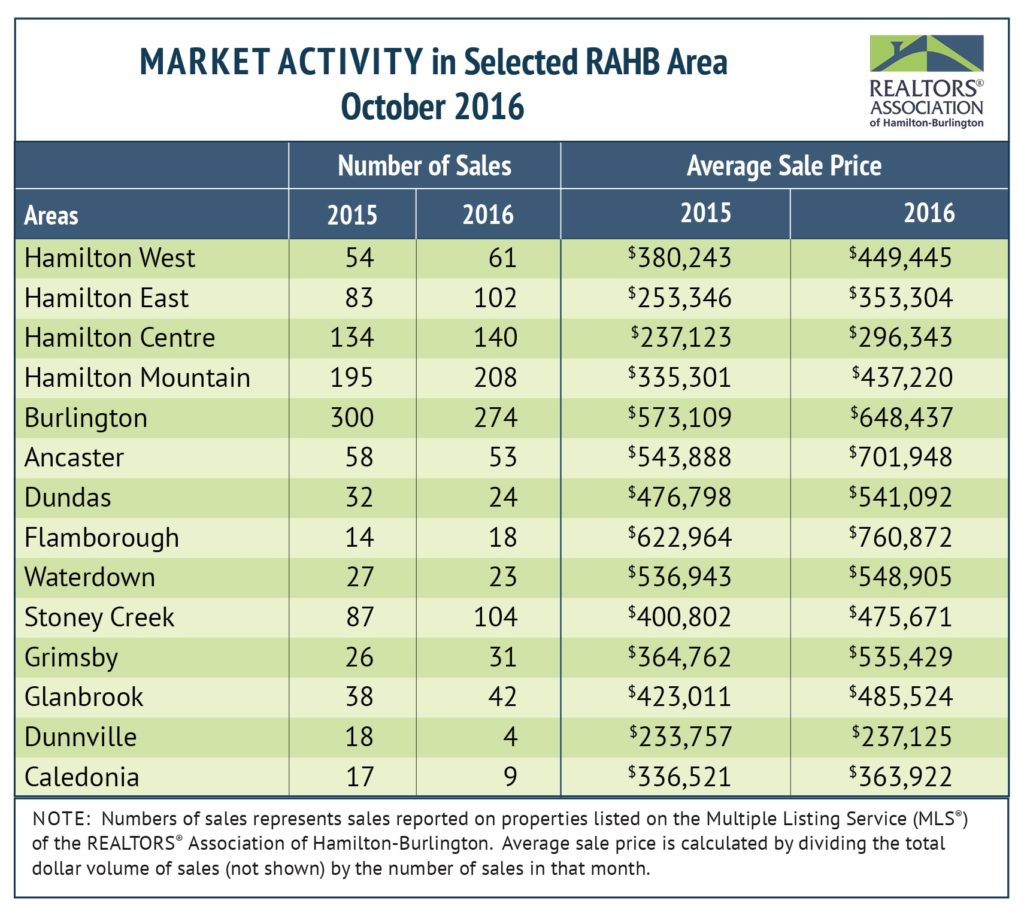
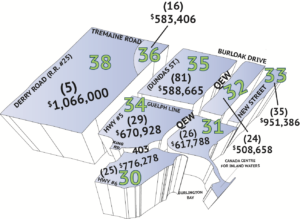
Every community in RAHB’s market area has its own localized market. Please refer to the accompanying chart, and contact a REALTOR® for more information.
 *Seasonal adjustment removes normal seasonal variations, enabling analysis of monthly changes and fundamental trends in the data.
About the REALTORS® Association of Hamilton-Burlington
Established in 1921, the REALTORS® Association of Hamilton-Burlington (RAHB) represents more than 2,990 real estate brokers and sales representatives from Hamilton, Burlington and outlying areas. Members of the Association may use the REALTOR® trademark, which identifies them as real estate professionals who subscribe to a strict code of ethics. The Association operates the local Multiple Listing Service® (MLS®) System and provides ongoing professional education courses for its members. Advertisements of local MLS® property listings and information about the services provided by a REALTOR® can be found at REALTOR.ca. More information about RAHB is available at rahb.ca.
Nov 7, 2016 | MLS®, Stats & Technology |
How do you create your virtual tours? Have you ever used the Property Panorama service offered by RAHB? Take the survey at http://bit.ly/propertypanorama to help us make decisions about this feature.
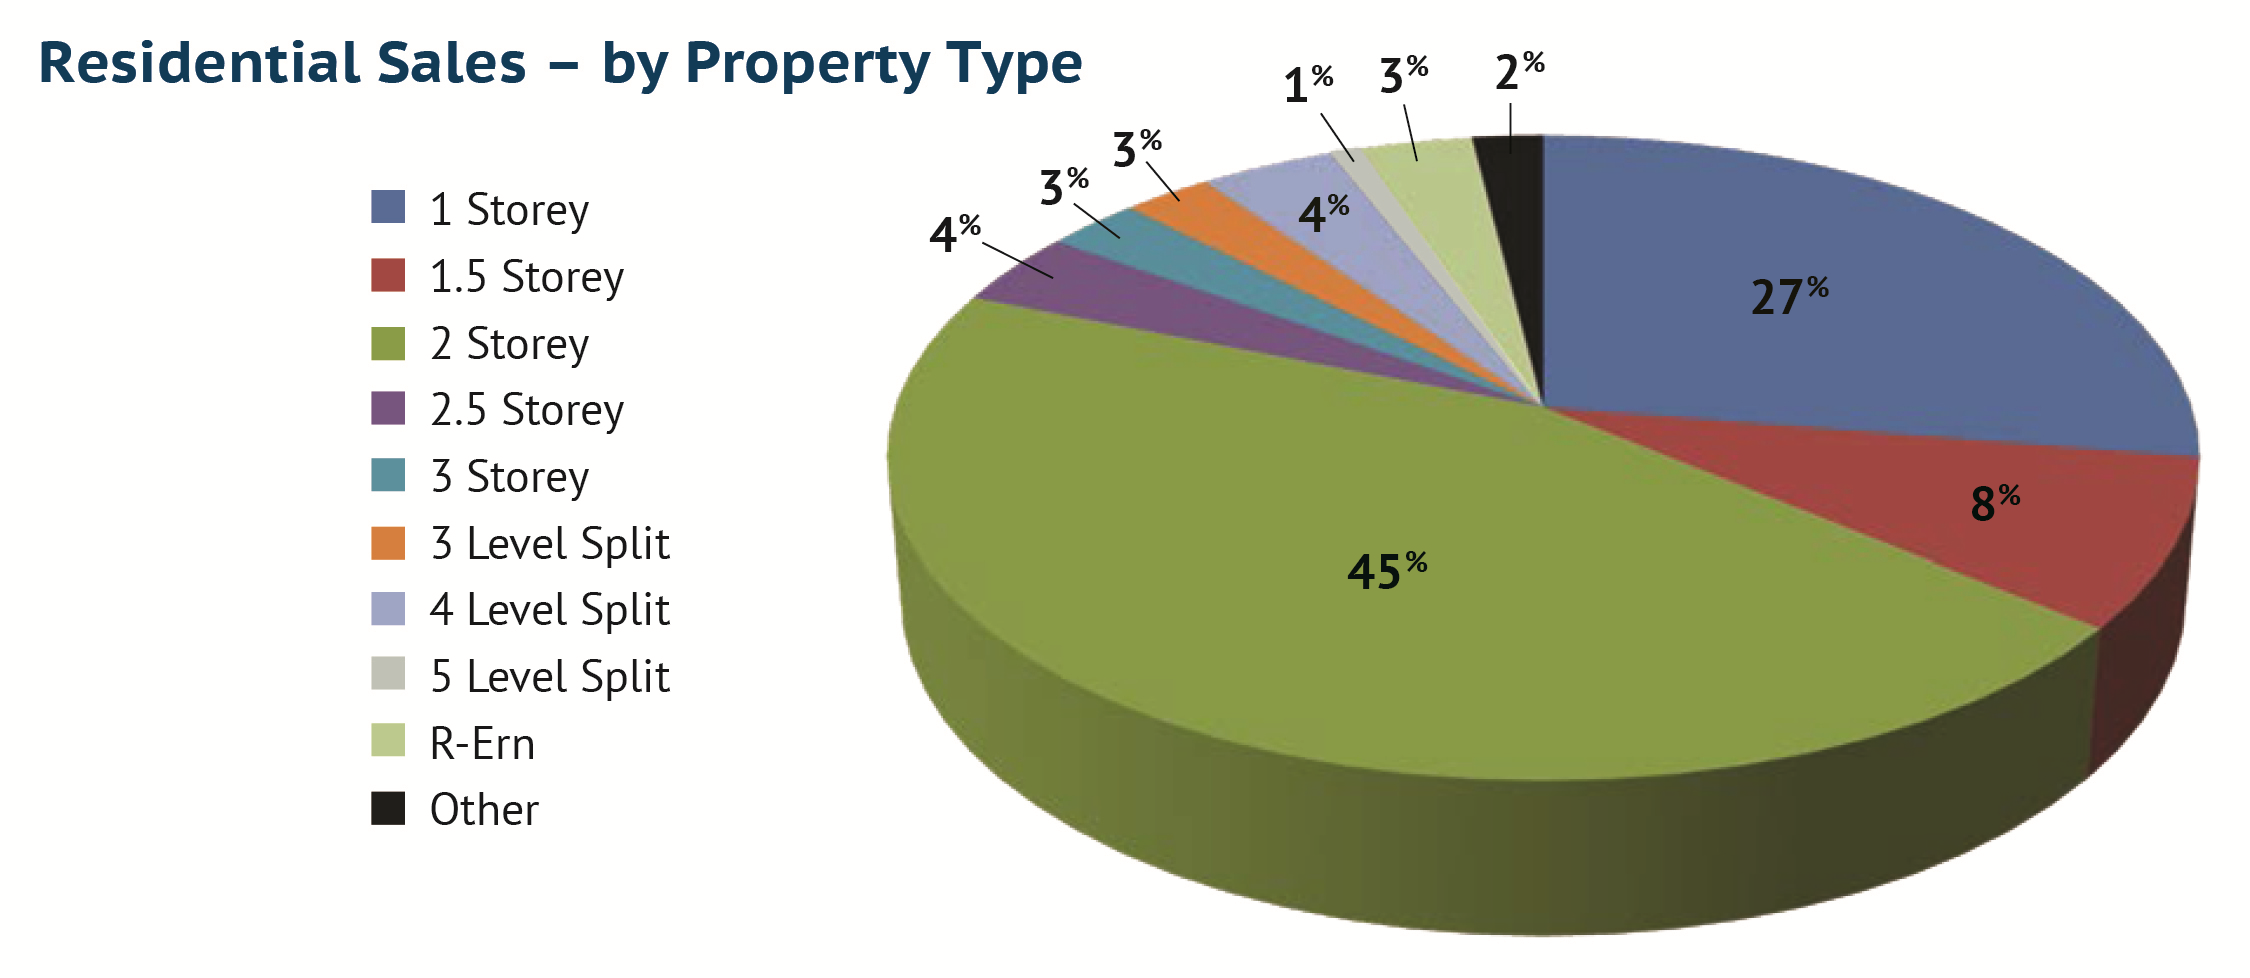
Oct 6, 2016 | MLS®, Stats & Technology |
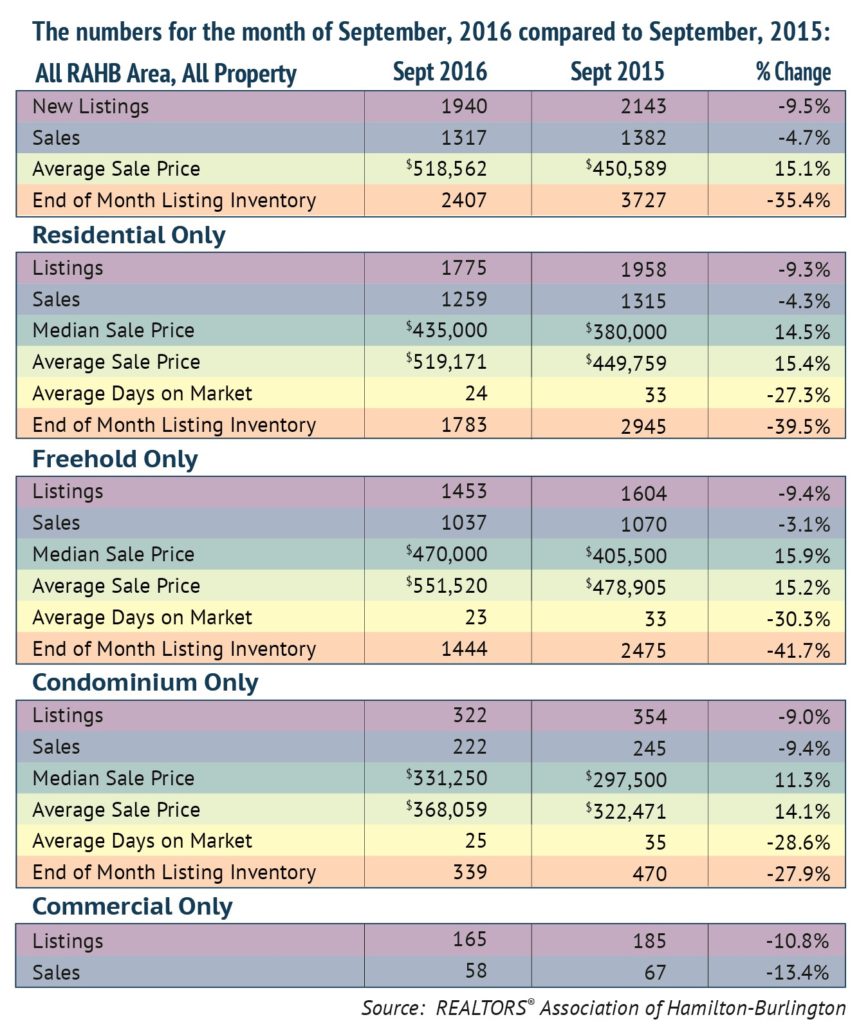
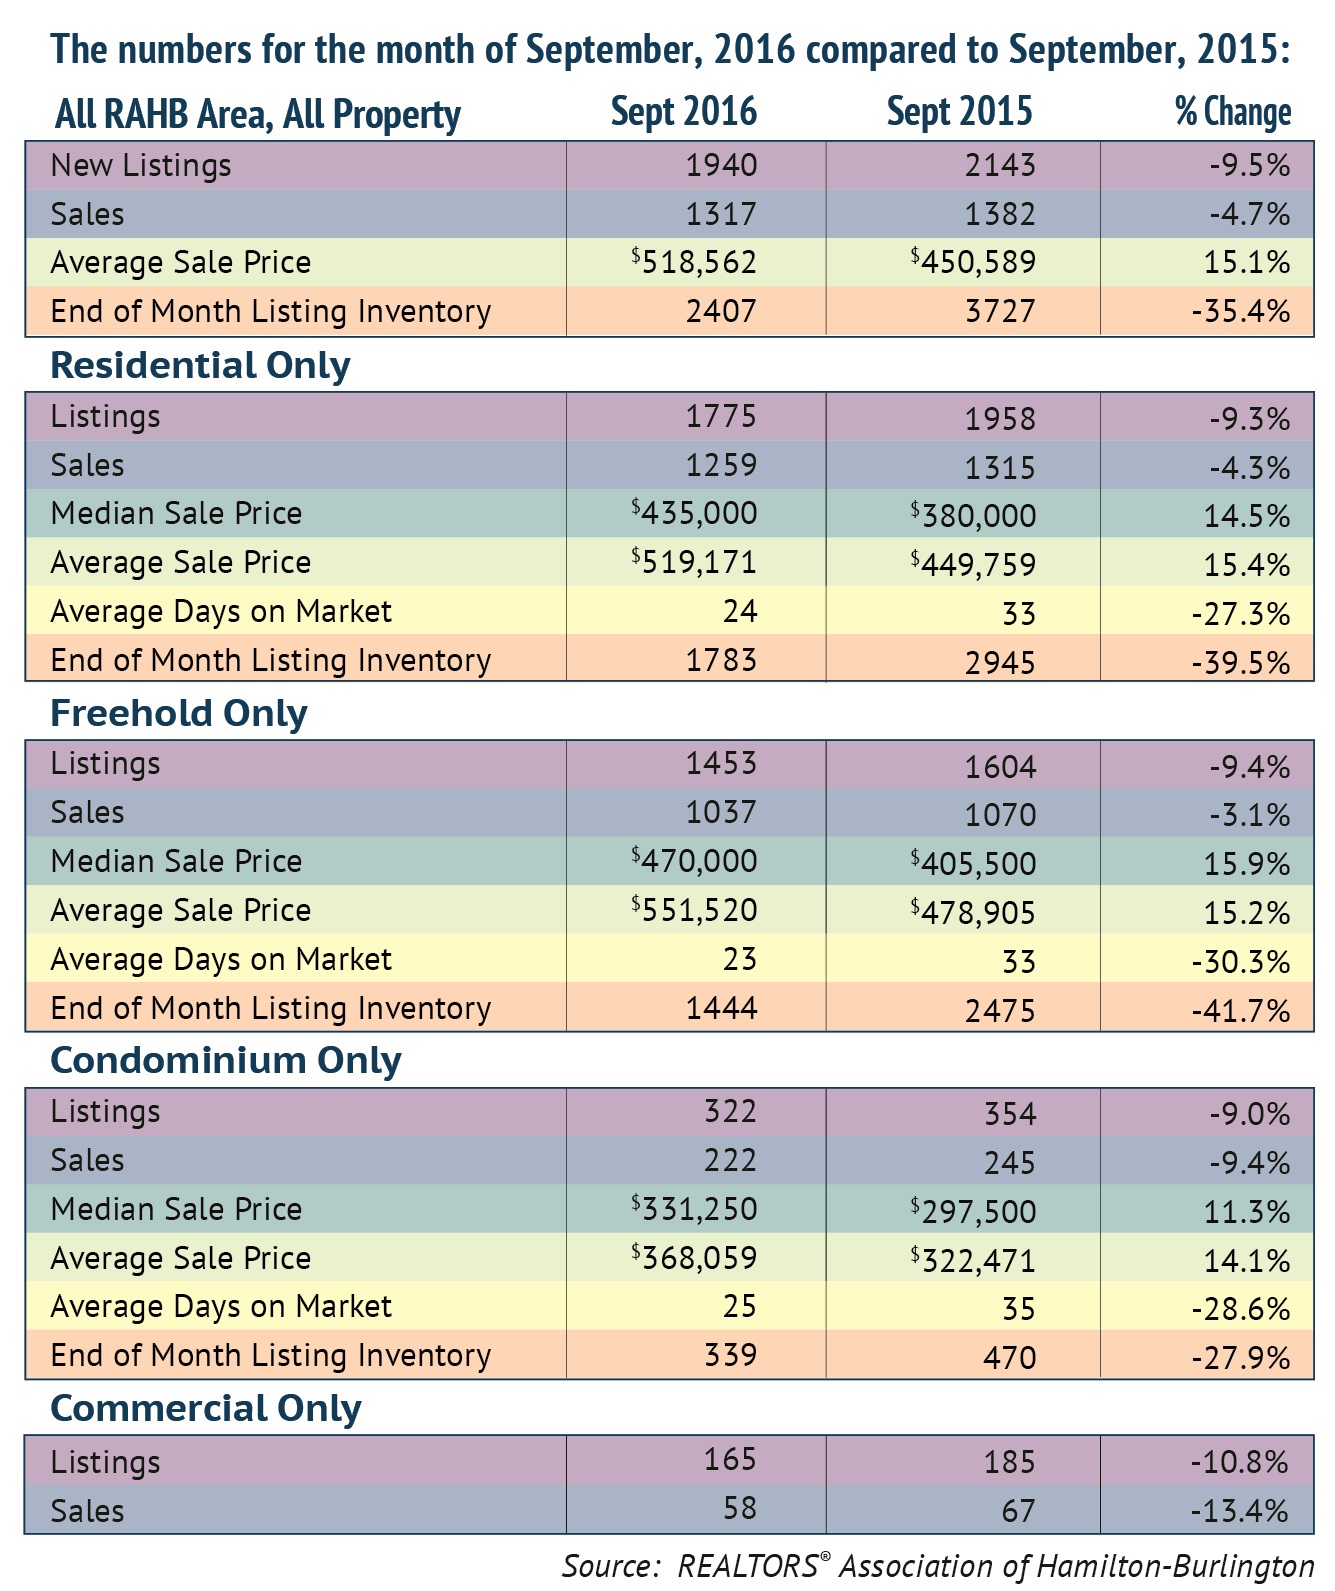
The REALTORS® Association of Hamilton-Burlington (RAHB) reported 1,317 sales were processed through the RAHB Multiple Listing Service® (MLS®) System in September. Sales were 4.7 per cent lower than the same month last year.
There were 1,940 properties listed in September, a decrease of 9.5 per cent compared to September of last year.
“The sales numbers are lower than last September’s, but the hot real estate market in the Greater Hamilton-Burlington area continues,” said RAHB CEO George O’Neill. “Sales are 16 per cent higher than the 10-year average, while the end of month inventory is 39.5 per cent lower than a year ago. The Hamilton-Burlington area continues to attract many people looking for a great place to live and work.”
Seasonally adjusted* sales of residential properties were 5 per cent lower than the same month last year, with the average sale price up 14 per cent for the month. Seasonally adjusted numbers of new listings were 8.3 per cent lower than September of 2015.
Seasonally adjusted data for residential properties for the month of September, 2016:
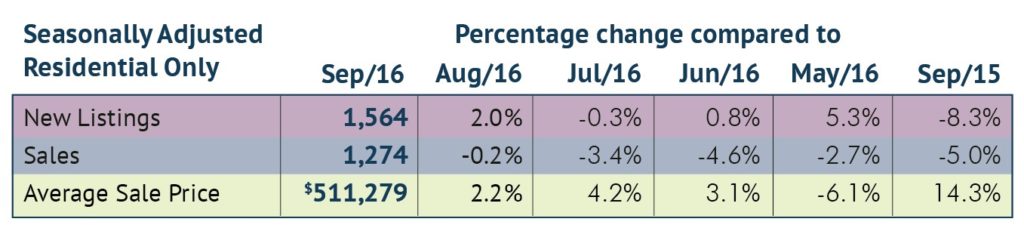 Overall residential sales of 1,259 units were 4.3 per cent lower than the same month last year. Residential freehold sales were 3.1 per cent lower than September of 2015 while sales in the condominium market were 9.4 per cent lower than the same month last year.
The median price of freehold properties increased by 15.9 per cent over the same month last year while the median price for condominium properties increased by 19.4 per cent compared to the same period.
The average price of freehold properties showed an increase of 5.1 per cent compared to September of last year; the average sale price in the condominium market increased by 11.3 per cent when compared to the same period.
Average sale price is based on the total dollar volume of all properties sold through the RAHB MLS® System. Average sale price can be useful in establishing long-term trends, but should not be used as an indicator that specific properties have increased or decreased in value. Contact a REALTOR® for information about your area or property.
The average number of days on market decreased from 33 to 23 days in the freehold market and from 35 to 25 days in the condominium market, compared to September of last year.
“A home in the Hamilton-Burlington area is selling, on average, 10 days quicker than a year ago,” noted RAHB President Kim Alvarez. “This follows the summer trend of quick turnover, and is a result of the limited number of listings compared to market demand.”
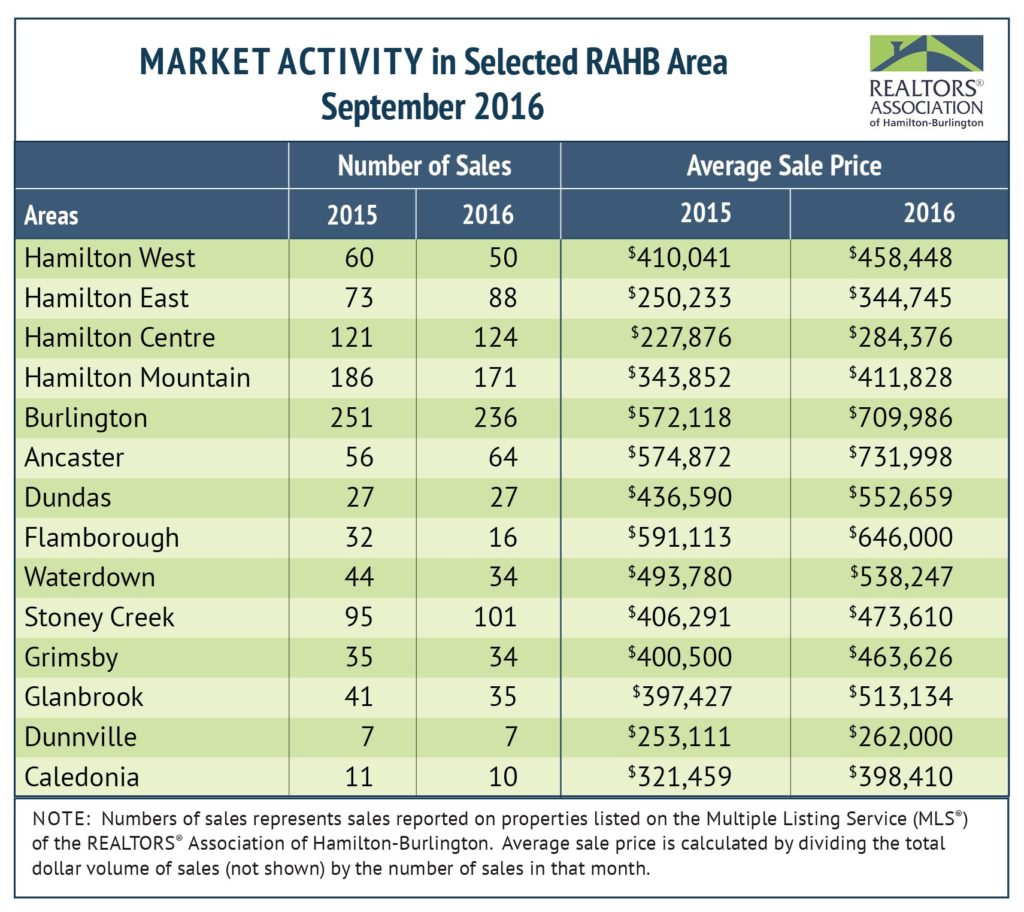
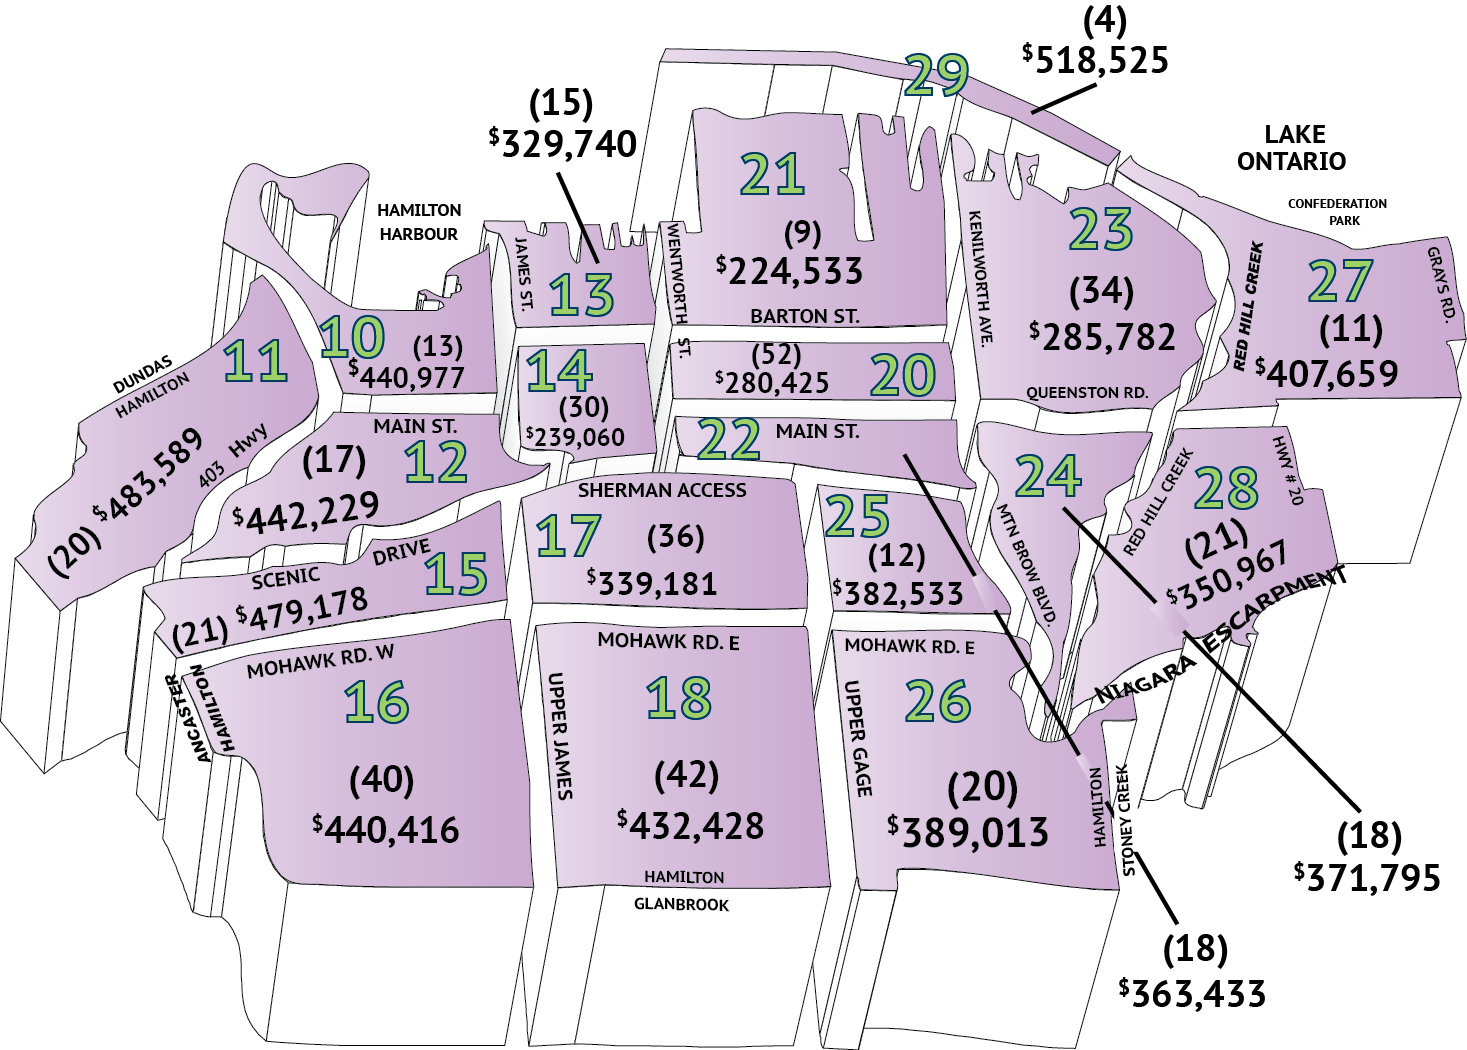
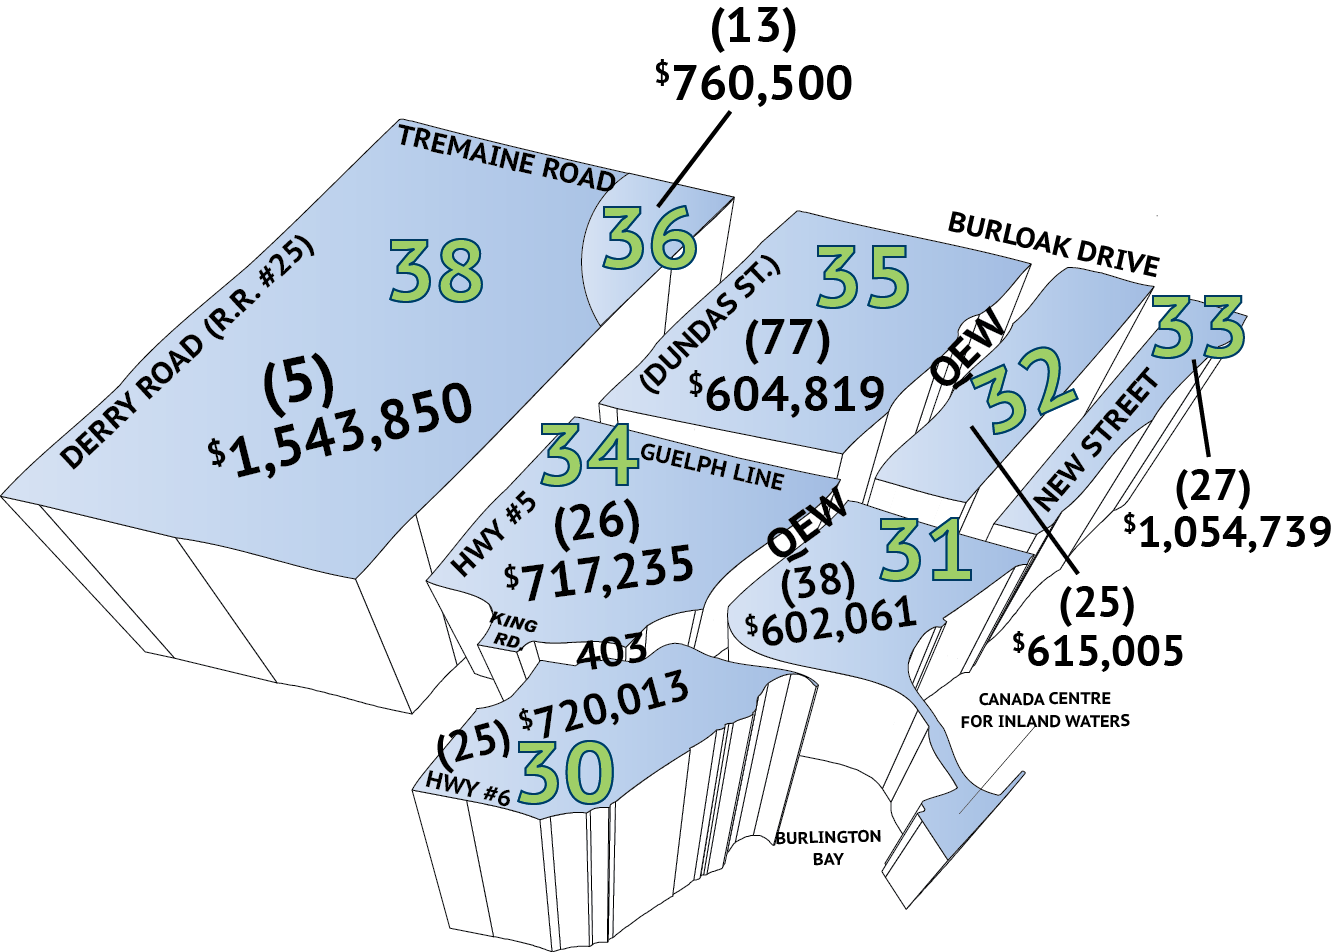
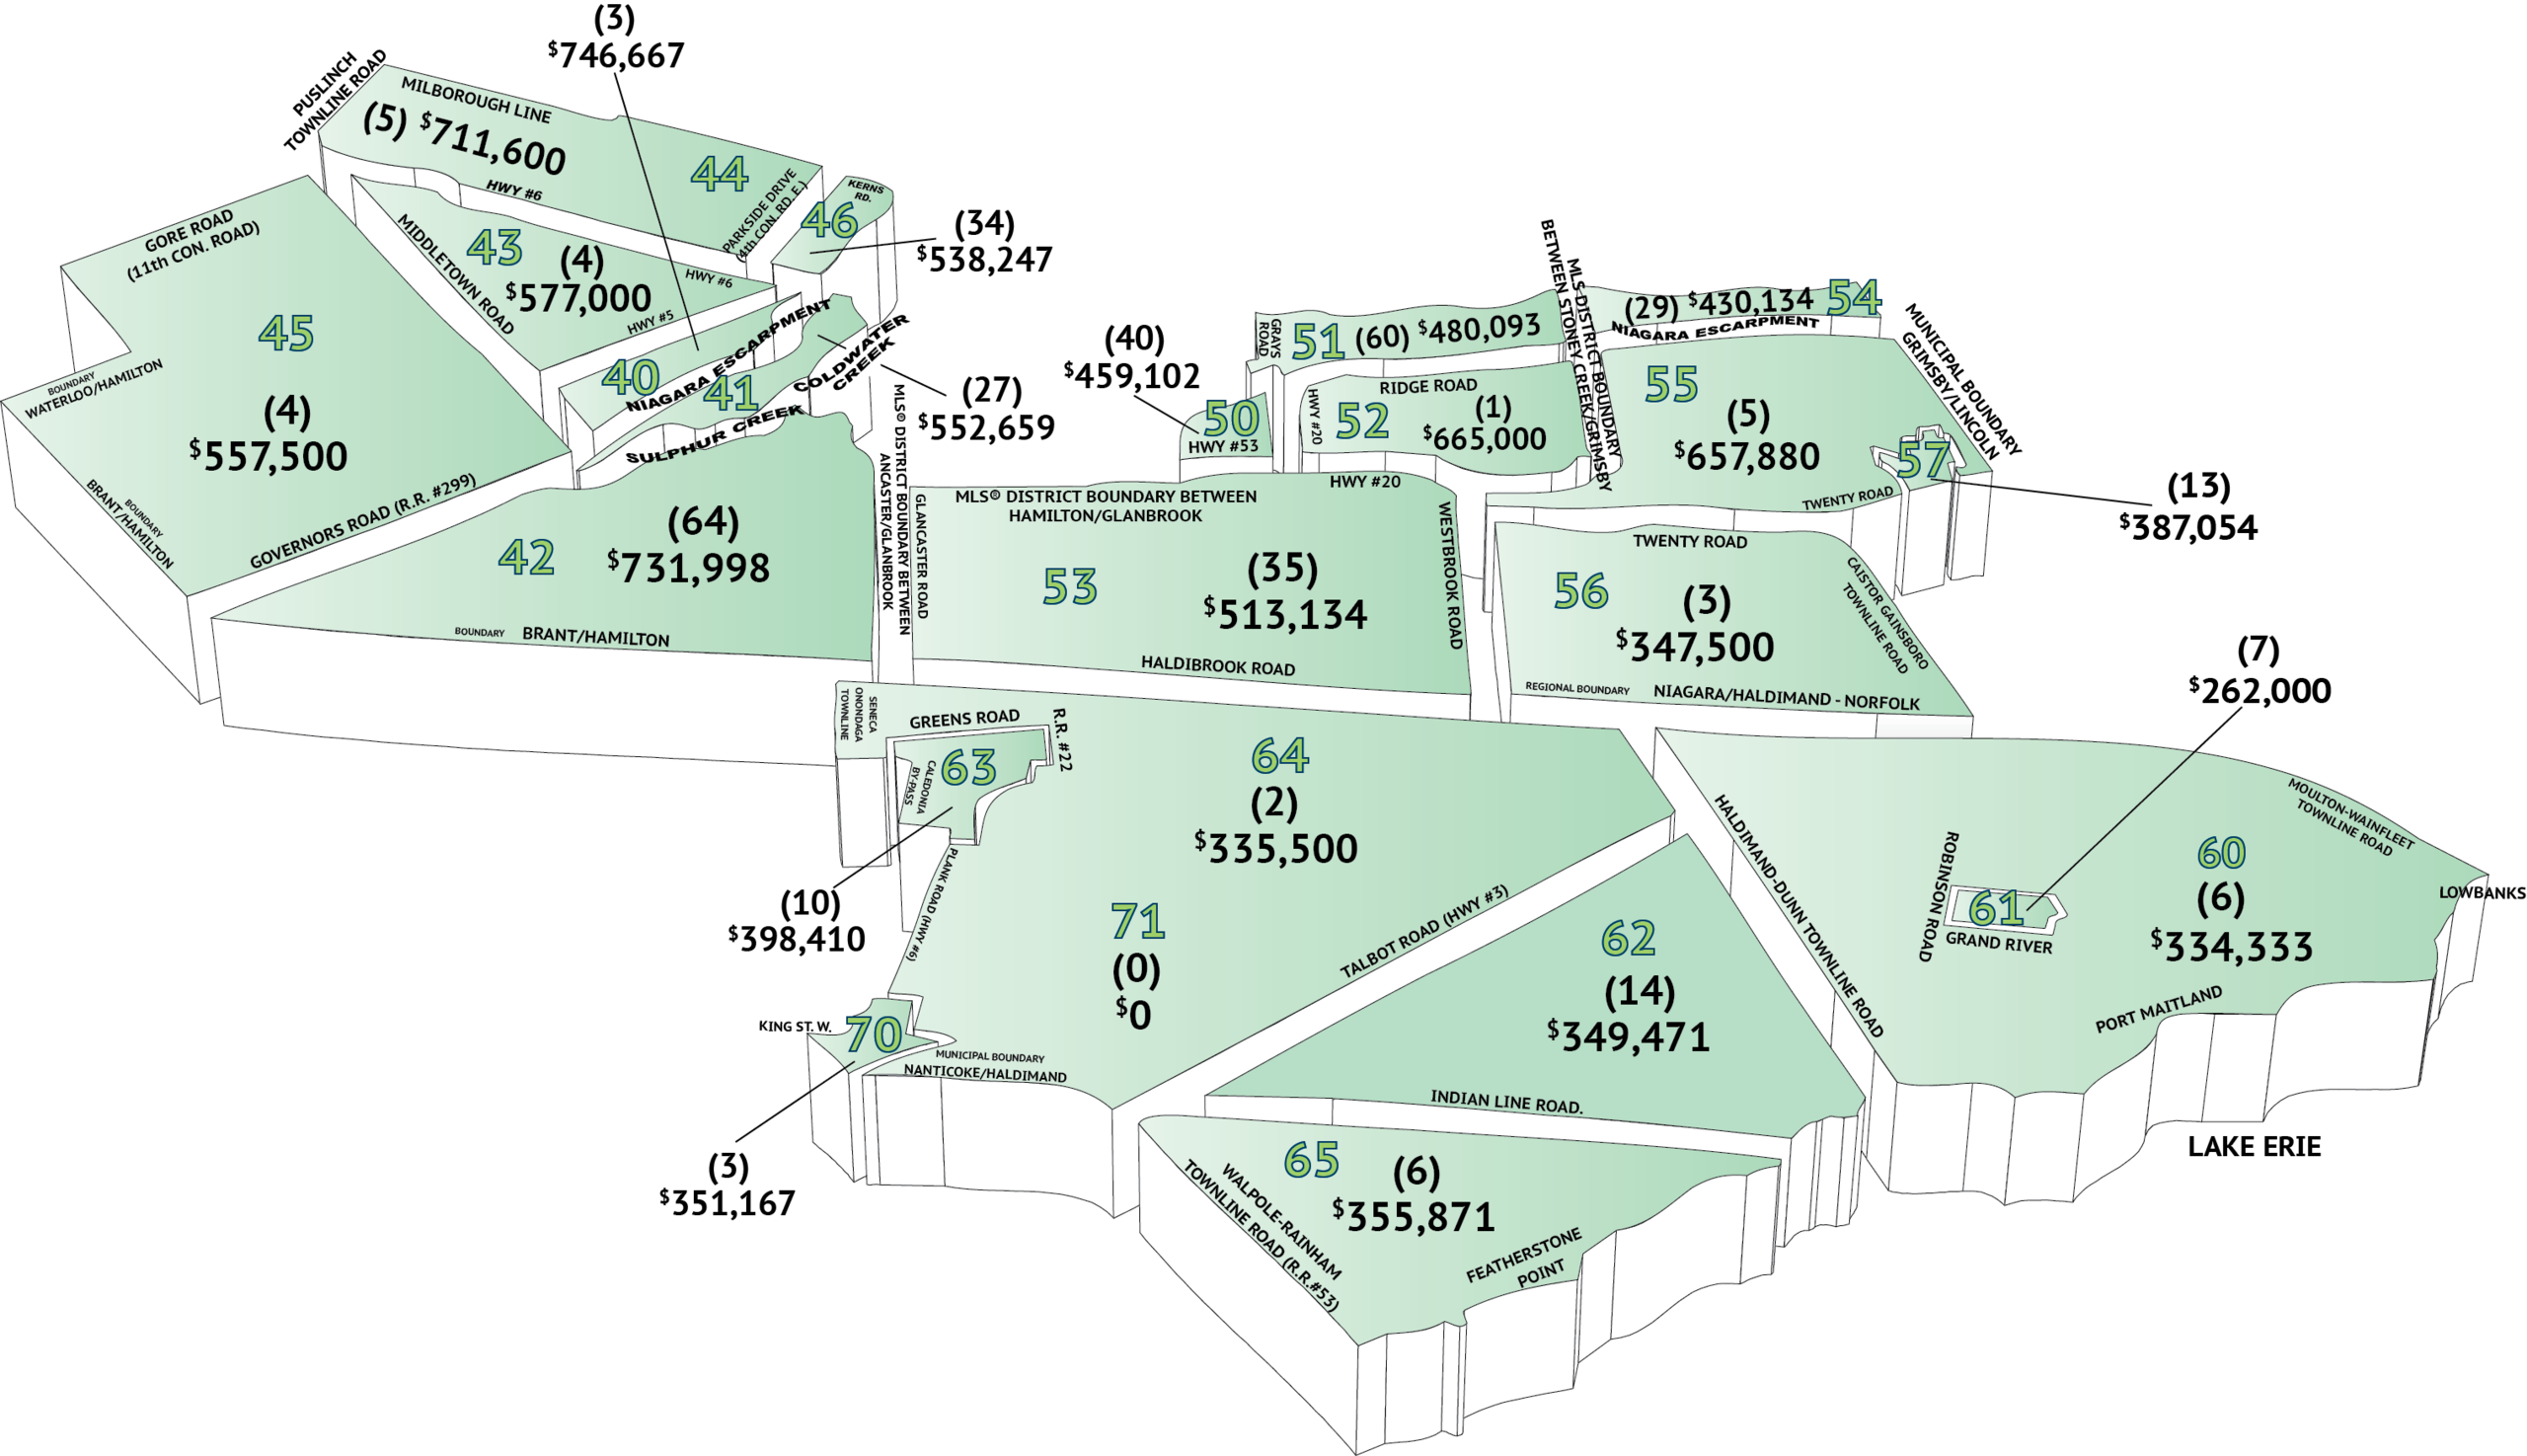
Every community in RAHB’s market area has its own localized market. Please refer to the accompanying chart, and contact a REALTOR® for more information.
*Seasonal adjustment removes normal seasonal variations, enabling analysis of monthly changes and fundamental trends in the data.
_________________________________________________________________________________
About the REALTORS® Association of Hamilton-Burlington
Established in 1921, the REALTORS® Association of Hamilton-Burlington (RAHB) represents more than 2,990 real estate brokers and sales representatives from Hamilton, Burlington and outlying areas. Members of the Association may use the REALTOR® trademark, which identifies them as real estate professionals who subscribe to a strict code of ethics. The Association operates the local Multiple Listing Service® (MLS®) System and provides ongoing professional education courses for its members. Advertisements of local MLS® property listings and information about the services provided by a REALTOR® can be found at REALTOR.ca. More information about RAHB is available at rahb.ca.
Oct 6, 2016 | MLS®, Stats & Technology |
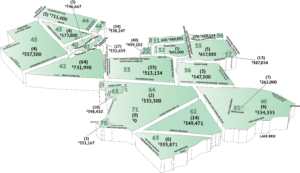
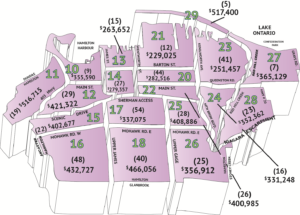
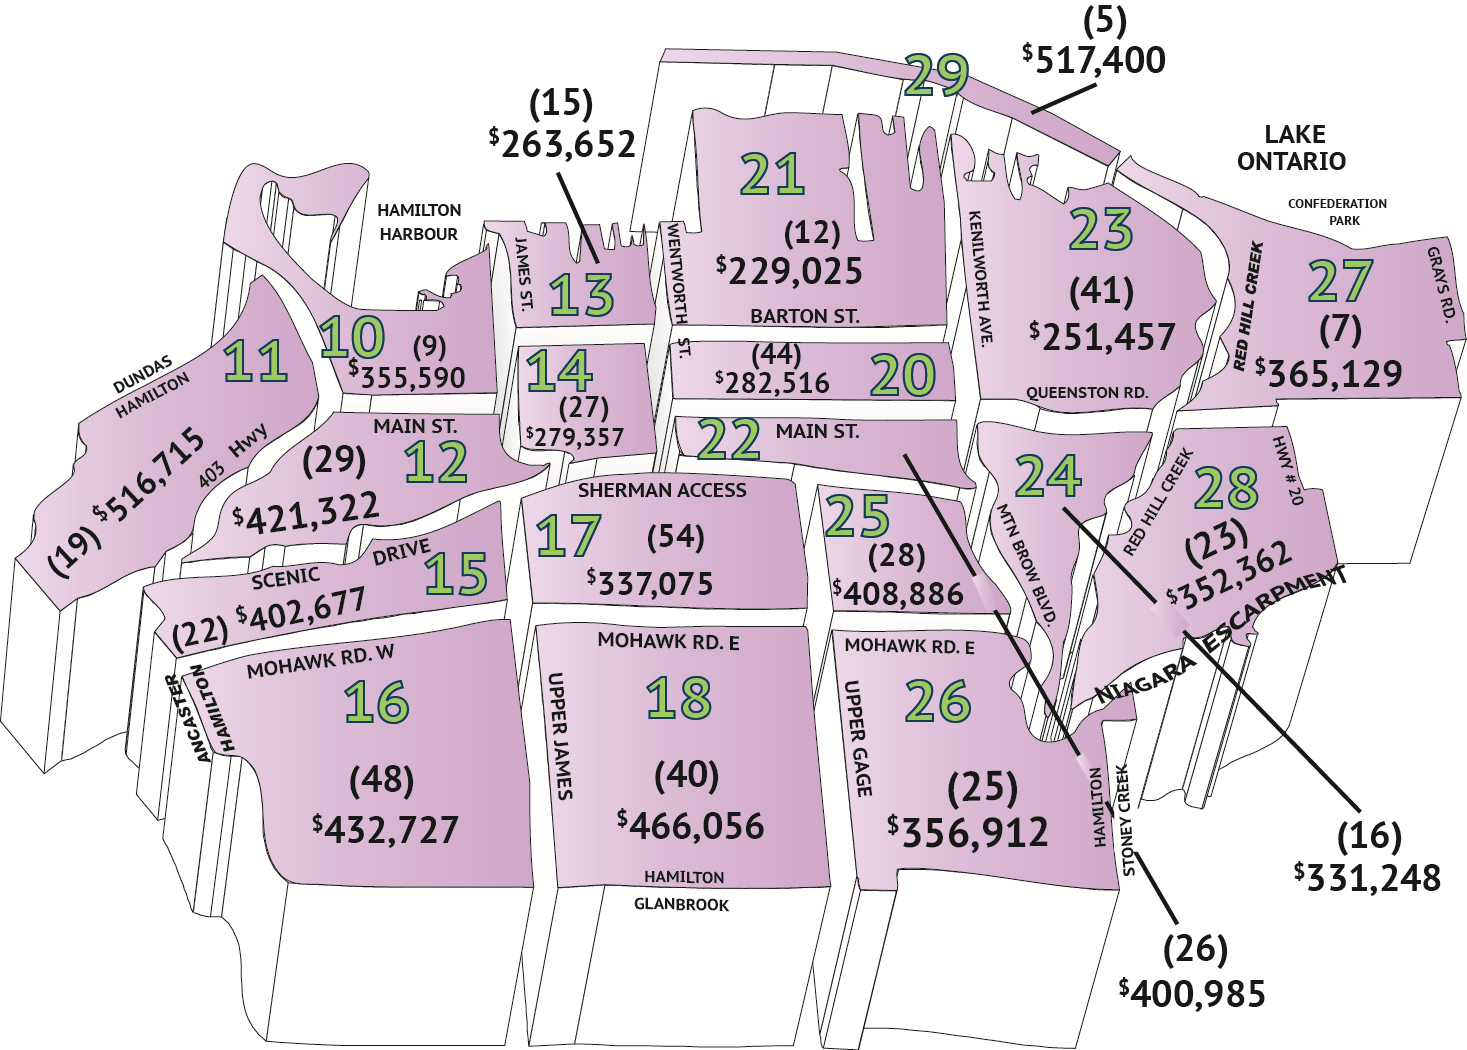
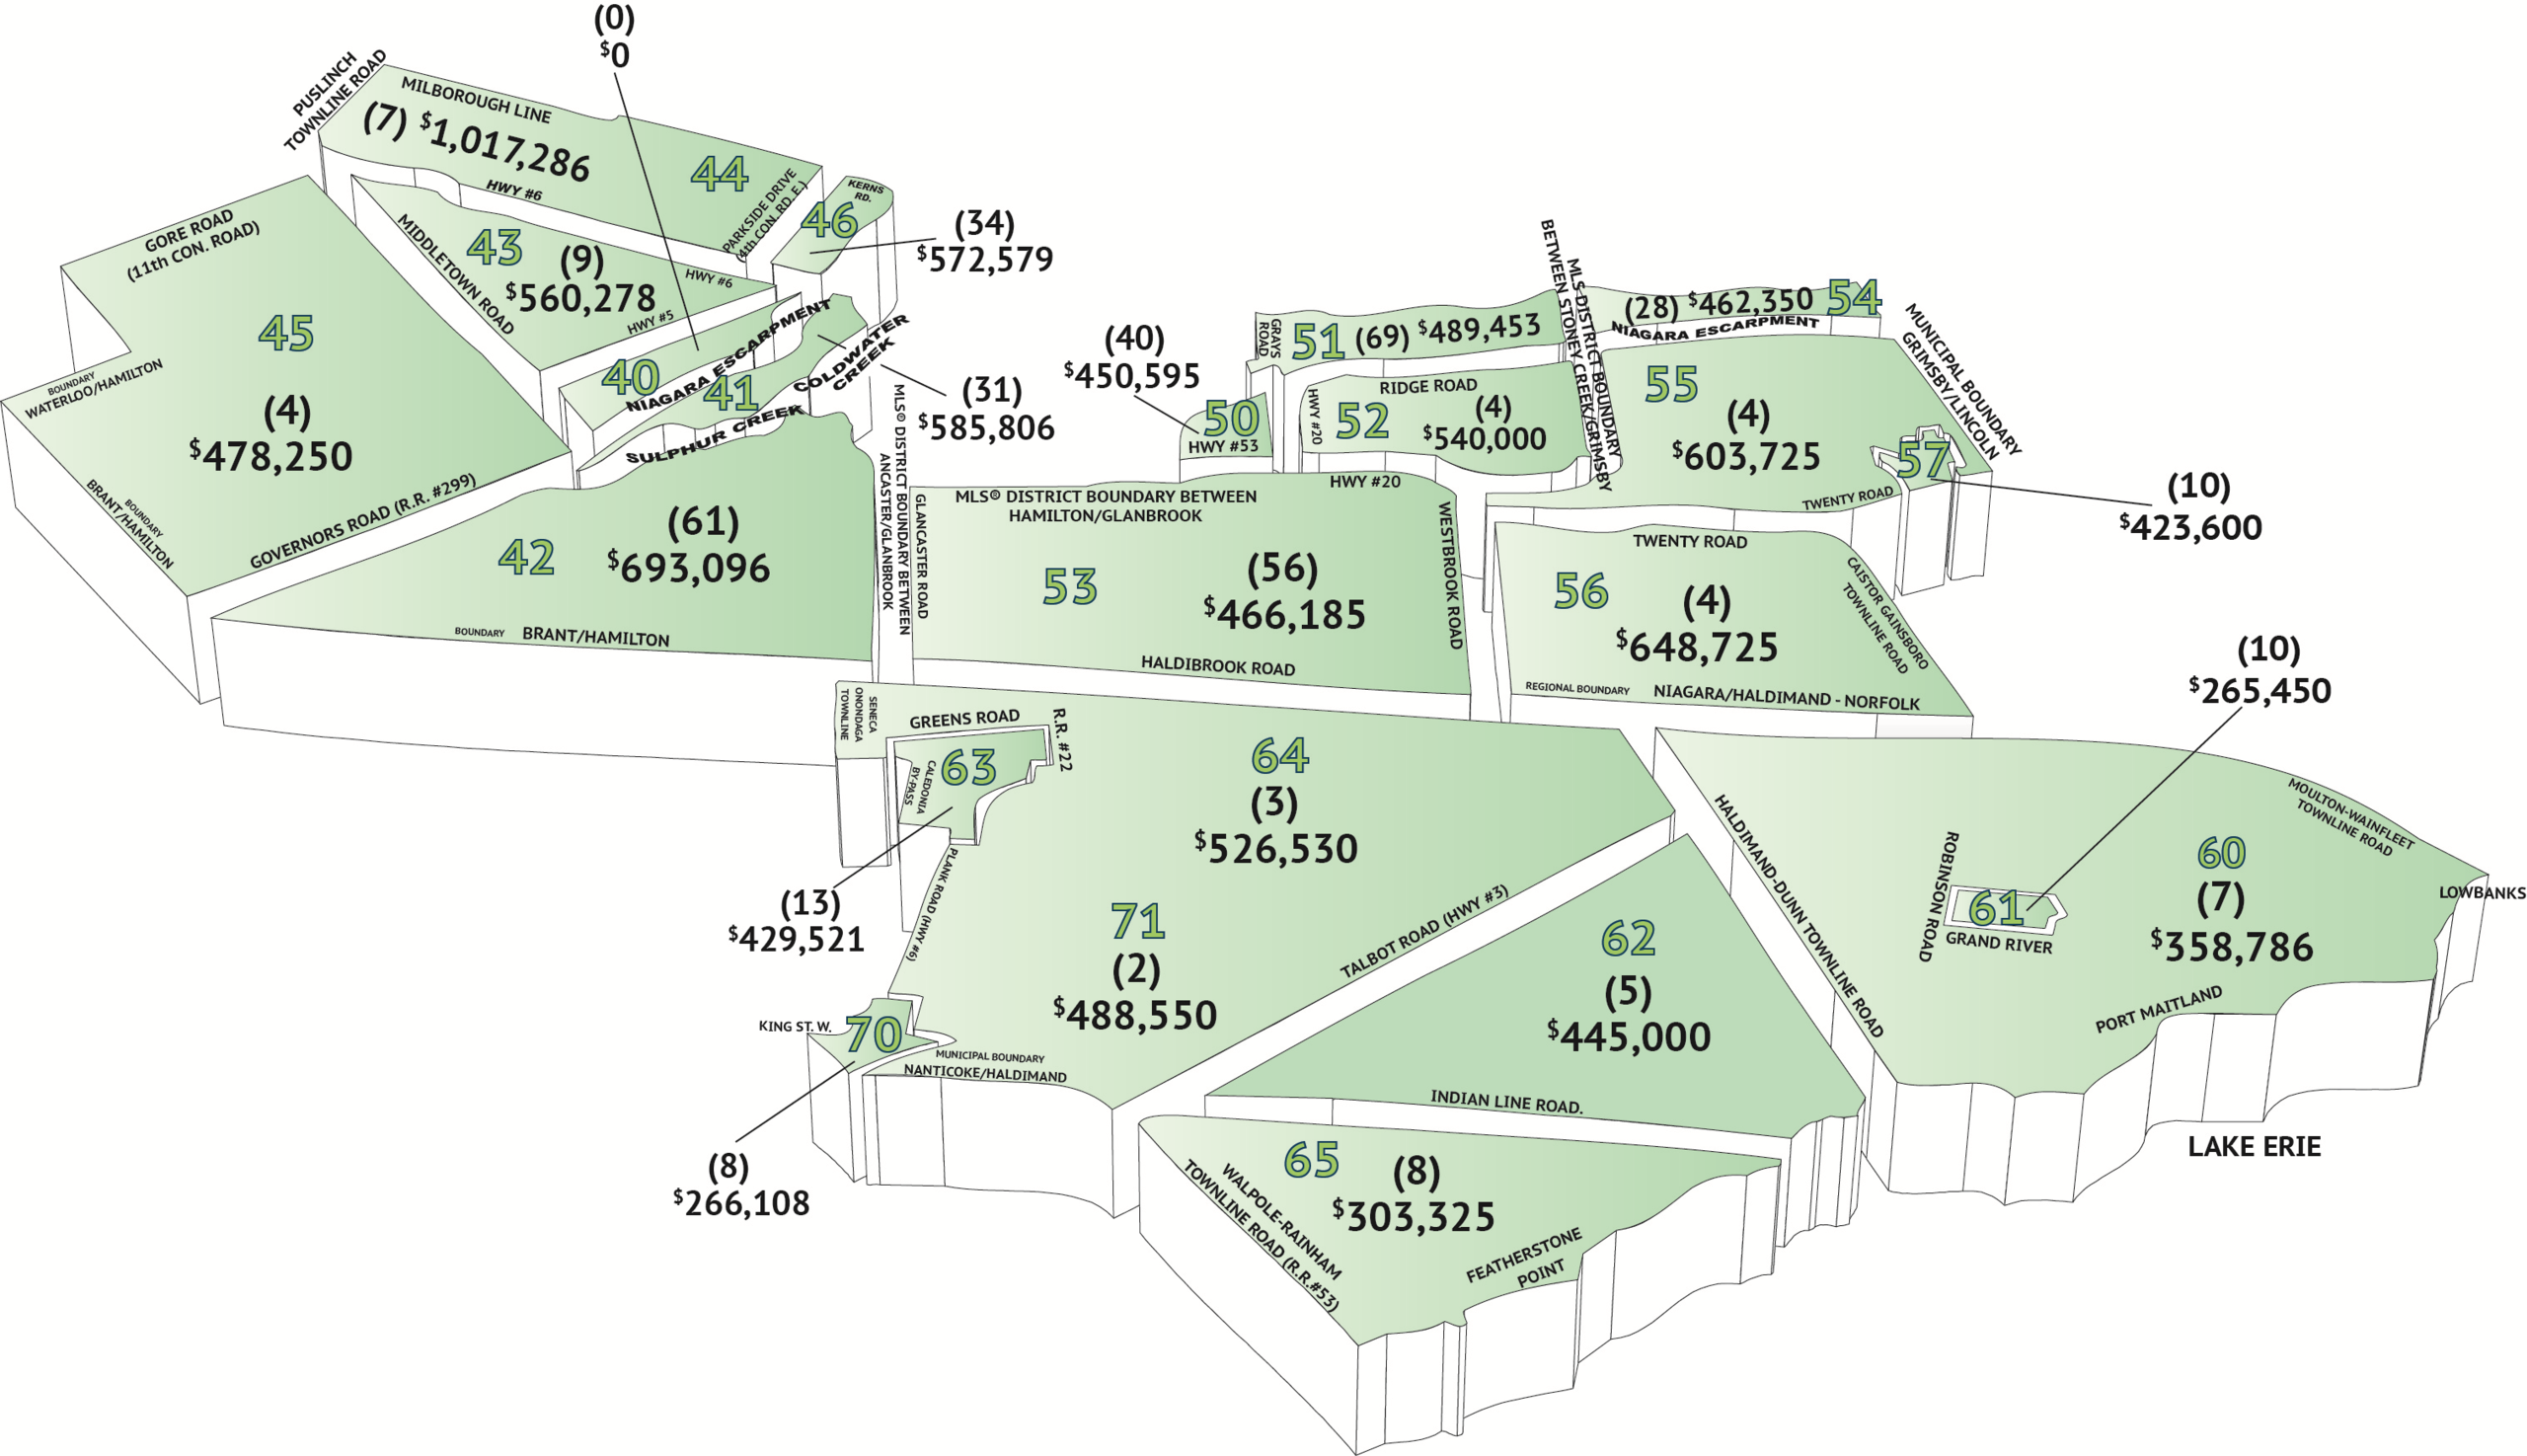
RAHB Average Price by District – (#) Residential Unit Sales
Hamilton
Hamilton West, 10 – 12
Hamilton East, 23, 24, 27 – 29
Hamilton Centre, 13, 14, 20 – 22
Hamilton Mountain, 15 – 18, 25 & 26
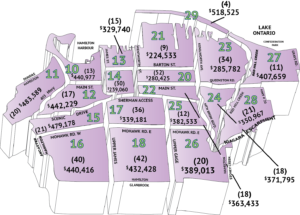
Burlington 30 – 36, 38
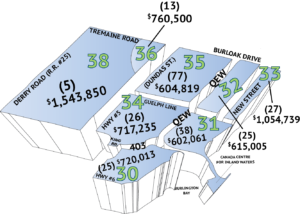
Outlying
Flamborough, 40, 43 – 45
Dundas, 41
Ancaster, 42
Waterdown, 46
Stoney Creek, 50 – 52
Glanbrook, 53
Grimsby, 54 -55
West Lincoln, 56
Smithville, 57
Dunnville, 61
Cayuga, 62
Calendonia/Hagersville, 63 & 70
Onieda/Seneca, 71 & 64
Rainham, 65
Canborough/Dunn, 60
Oct 6, 2016 | MLS®, Stats & Technology |


Oct 6, 2016 | MLS®, Stats & Technology |
Would you take a short survey about Property Panorama? Use this link to the survey on Survey Monkey and help us make decisions about this feature.
Thanks for your assistance!
Oct 6, 2016 | MLS®, Stats & Technology |
The Board of Directors recently approved the following changes to the MLS® Rules and Regulations and MLS® Policies:
- MLS® Rules and Regulations, Section 2, Sub-section 2.15 regarding “no offers until” was amended so that OREA form 244 “Seller’s Direction re: Property/Offers” should be used to document the Seller’s instructions for “no offers until”. Section 2.15 now reads: 2.15 If an MLS® listing indicates that offers are not to be presented for a period of time, the listing brokerage shall complete, as part of the listing, the seller’s written direction on the OREA form “Seller’s Direction re: Property/Offers and disclose all particulars of such direction in the “Remarks” field of the MLS® listing. Should the seller rescind a restriction pertaining to the presentation of offers, the Listing Brokerage shall immediately, and with reasonable notice to all parties:(a) complete, as part of the MLS® listing, the Seller’s written direction on the Association’s form entitled “Amendment to Listing Agreement” and make the necessary changes to the “Remarks” field for such MLS® listing; and
(b) if the listing brokerage is representing the Seller in the negotiation of offers, notify by telephone, all Co-operating Brokerages, who requested and/or registered offer presentations, that such restriction is removed and arrange for the presentation of all offers to the Seller, without delay.
- MLS® Rules and Regulations, Section 12 – 12.01 Trading Procedures was amended by the deletion of sub-section 12.01 regarding deposits. The section that was deleted was: Section 12 – Trading Procedures12.01 In all cases, Brokerages shall make every attempt to obtain adequate deposits. Such deposits shall be made out in the name of the Listing Brokerage, unless otherwise directed by their client, and turned over to the Listing Brokerage, or as otherwise directed by such client, together with a copy of the Agreement of Purchase and Sale or other agreement evidencing the trade in real estate. When the deposit is held by the Co-operating Brokerage, they shall disburse funds in accordance with written directions of the Listing Brokerage or the Seller, as applicable.
- MLS® Policies – RAHB Members Open House was amended by the deletion of Policy #5 regarding a change of open house hours on a day of a RAHB membership meeting. The section that was deleted was: 5. If there is a general membership meeting of the association on the scheduled open house date, the open house will be held from 11:00 a.m. To 1:00 p.m.
These changes are effective immediately. The RAHB MLS® Rules and Regulations and MLS® policies are posted in REALTOR Link®.
Oct 6, 2016 | MLS®, Stats & Technology |
MLS® Reminder:
Make sure you and your administrative staff report these sales and leases according to the MLS® Policies:
1. Selling Brokerage is a non-RAHB member
The Selling Salesperson field should say “NONMEM” and the Selling Comments should have the notation “Sold by (Name of Selling Salesperson) – (Name of Selling Brokerage).”
2. Leases
The lease breakdown must be entered on the comment line, in the same unit as the list price. For example, if the list price is $14 per square foot and the lease price is $12 per square foot, the Selling Comments should show the breakdown and total volume for the lease.
Example – Leased for 1 year at $12 per square foot per month x 500 square feet = $72,000
Not sure about what the policies are? You can find the MLS® Rules and Regulations and MLS® Policies on REALTOR Link® (under the MLS® tab), in Fusion under the Resources gadget – click on the RAHB Documents link, and in the RAHB section of Matrix Links.
Oct 6, 2016 | MLS®, Stats & Technology |
Have you ever seen a Commission to Listing Brokerage that said “1” and left you wondering if that meant $1 or 1%? Wouldn’t it be better for everyone if it was specified if the commission was a dollar amount or a percentage?
So that everyone is clear on what the commission to the selling brokerage will be, be sure you indicate in the Commission to Selling Brokerage field whether the amount is a percentage or a dollar amount. That way, everyone will know what to expect.
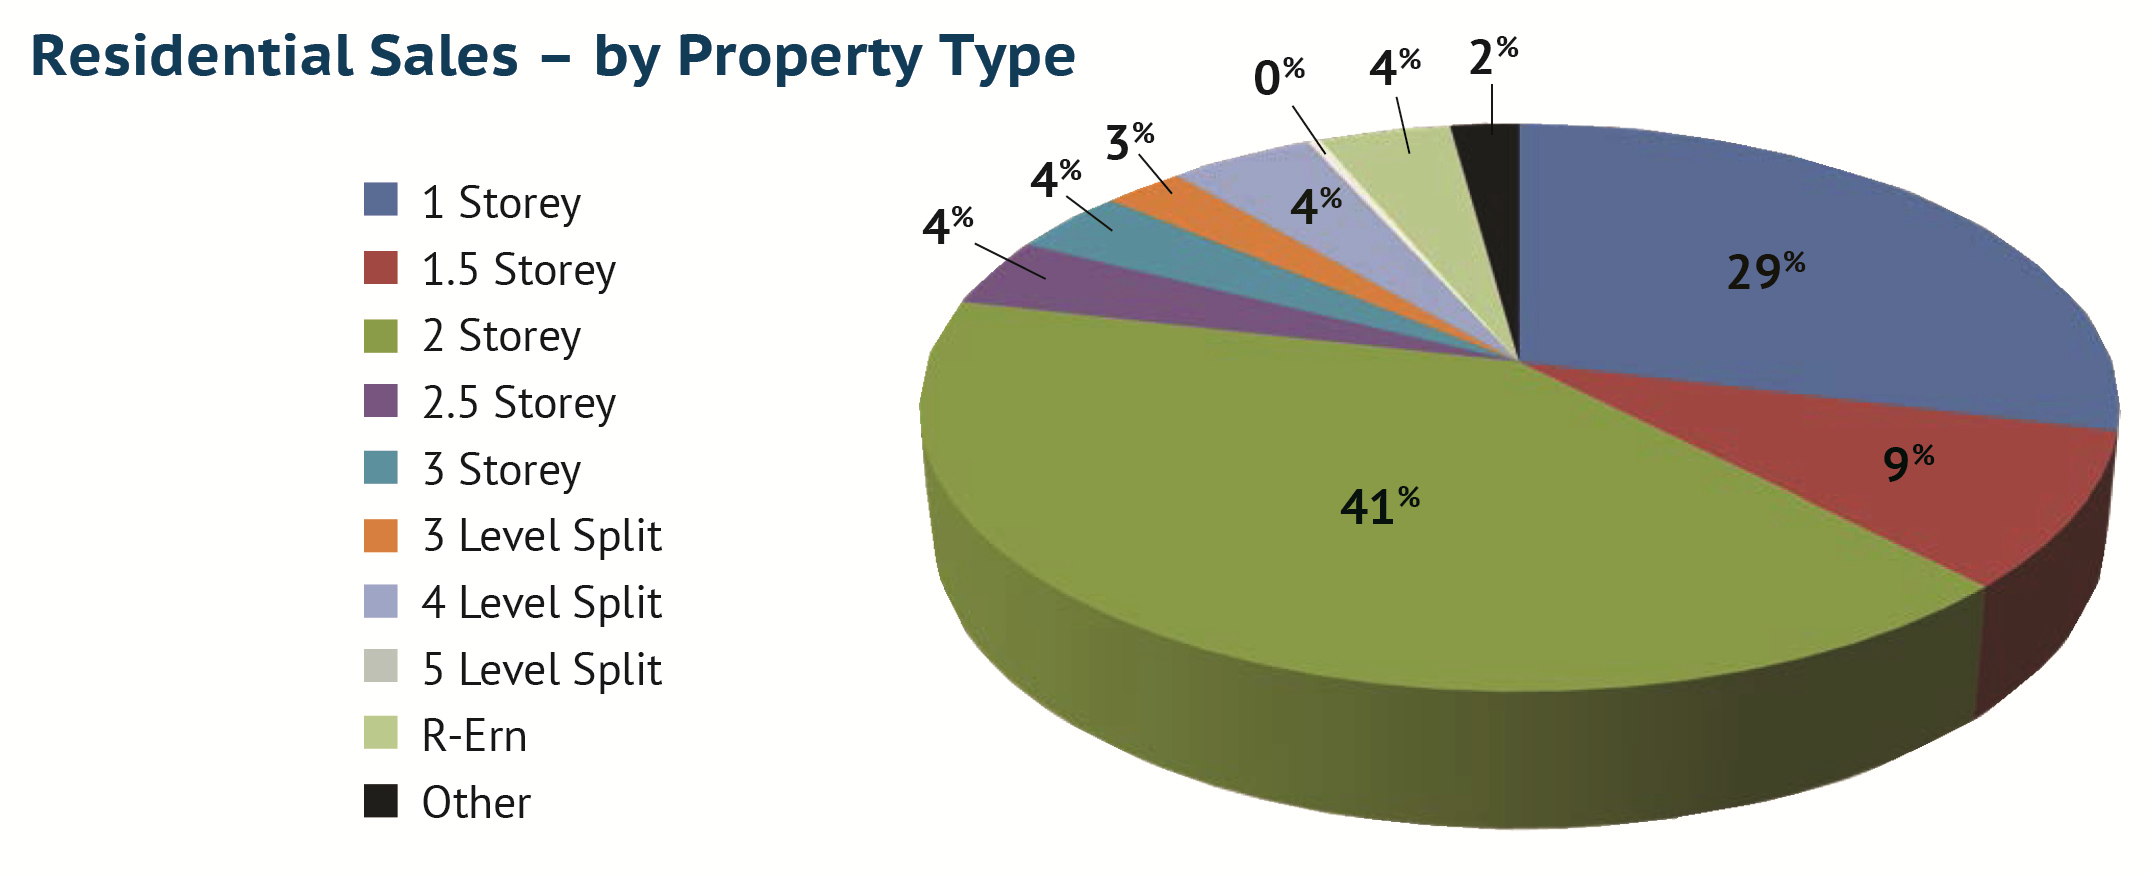
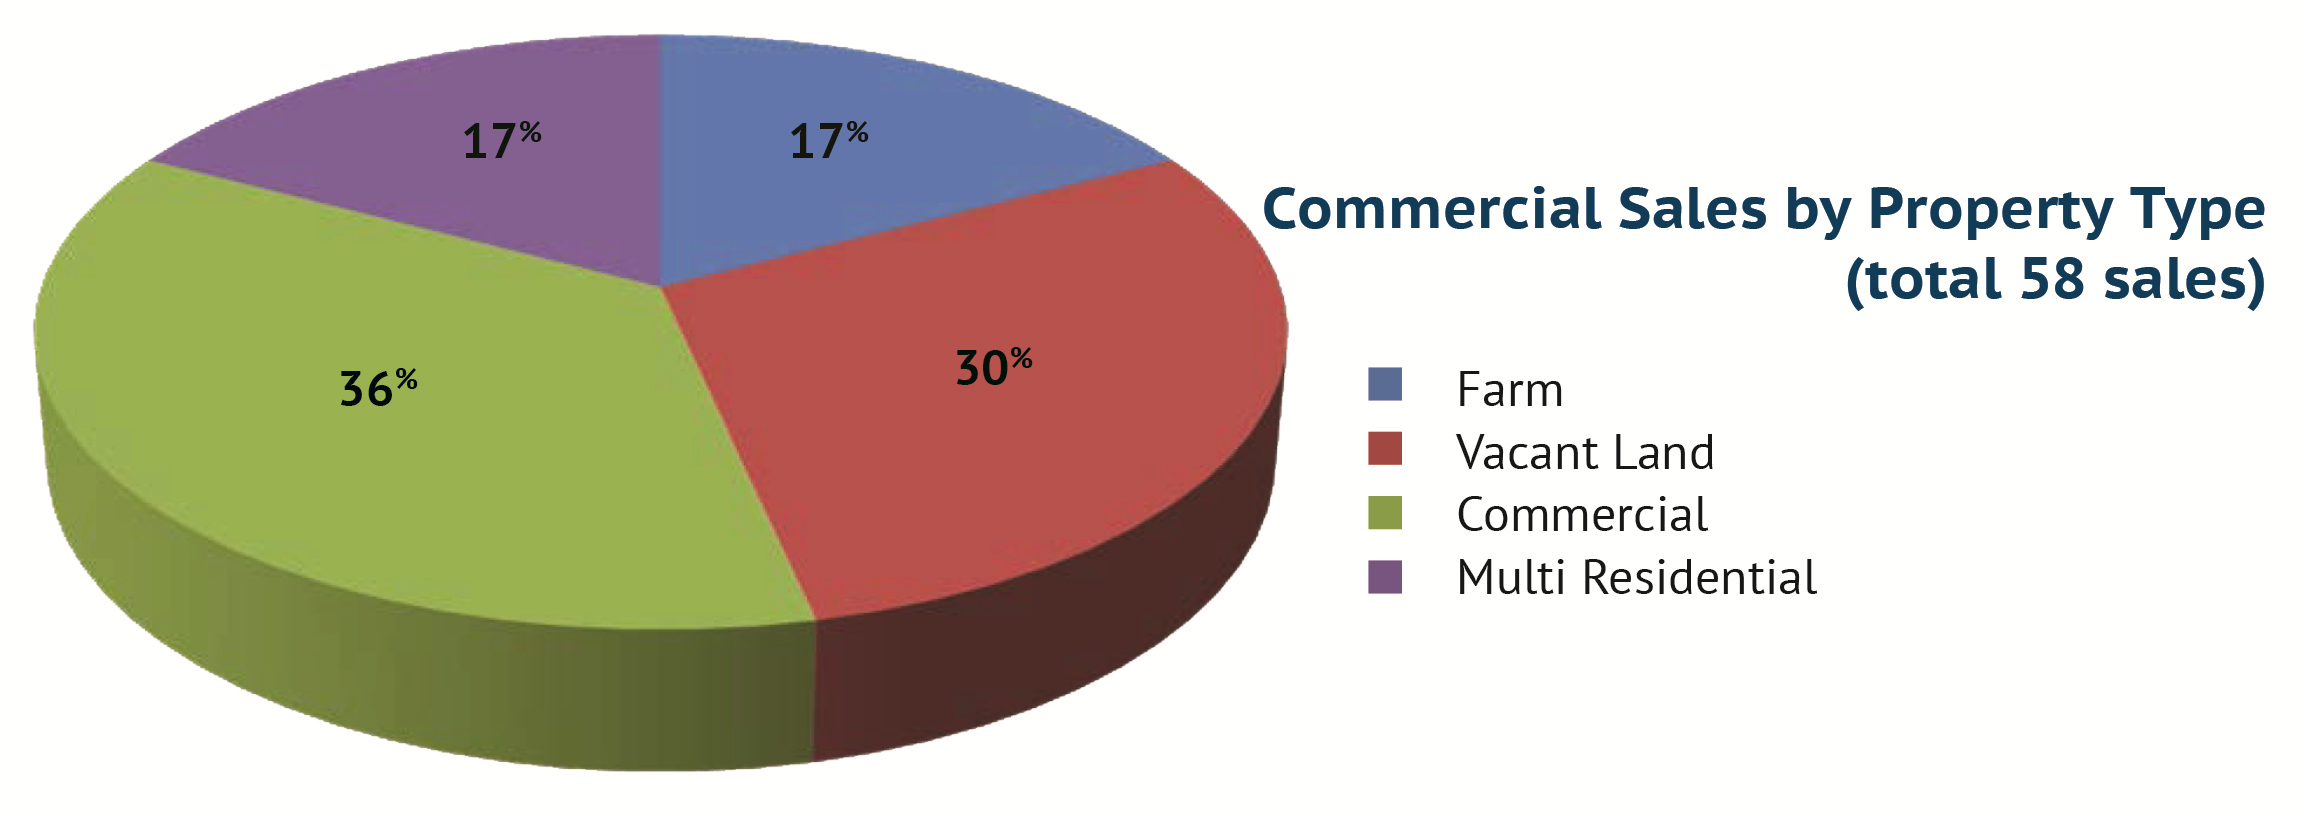
Oct 5, 2016 | MLS®, Stats & Technology |
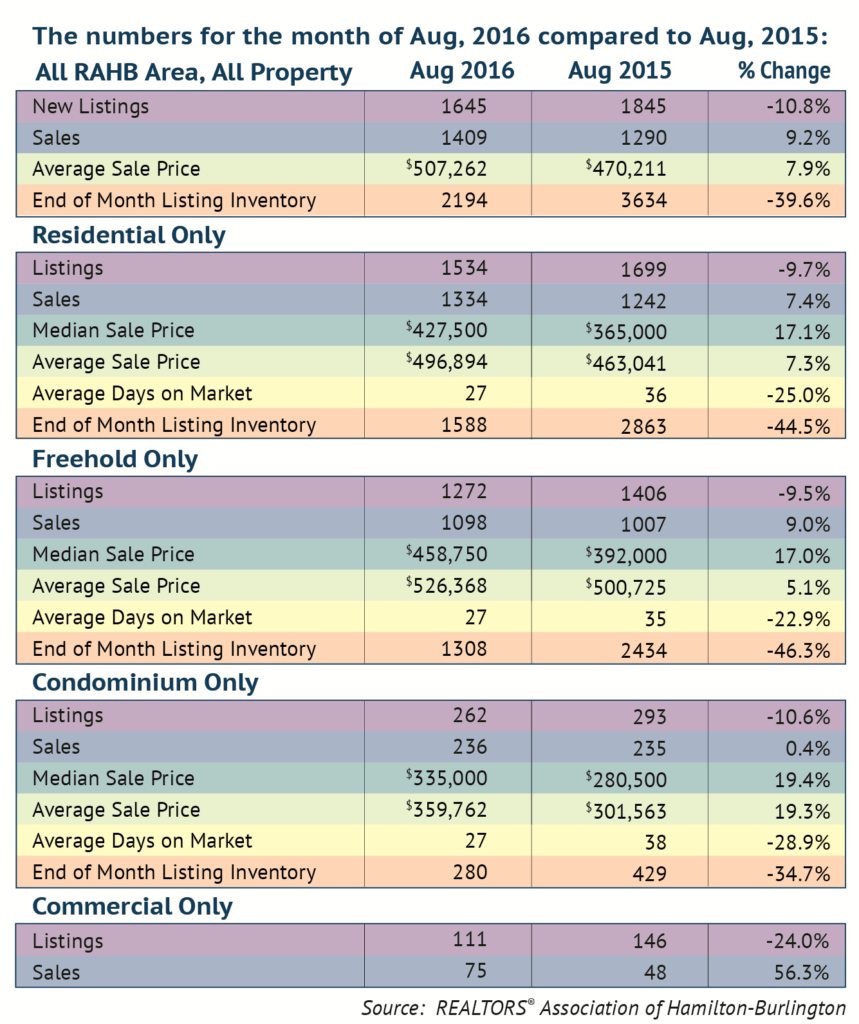
The REALTORS® Association of Hamilton-Burlington (RAHB) reported 1,409 sales were processed through the RAHB Multiple Listing Service® (MLS®) System in August. Sales were 9.2 per cent higher than the same month last year, and set a new record for sales in the month of August.
There were 1,645 properties listed in August, a decrease of 10.8 per cent compared to August of last year.
“The record sales in August 2016 came in on top of the record sales of August 2015. This is the third month this year (March, May 2016) that monthly sales have been record-breaking,” said RAHB CEO George O’Neill. “Once again we are seeing very strong sales while the number of listings remains low, leaving us firmly in a seller’s market.”
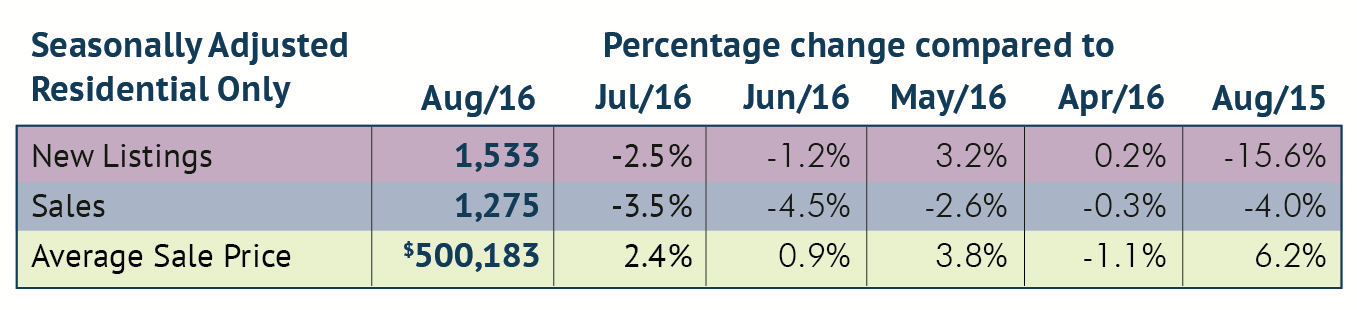
Seasonally adjusted* sales of residential properties were 4 per cent lower than the same month last year, with the average sale price up 6.2 per cent for the month. Seasonally adjusted numbers of new listings were 15.6 per cent lower than August of 2015.

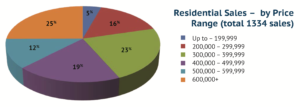
Actual overall residential sales of 1,334 units were 7.4 per cent higher than the same month last year. Residential freehold sales were 9 per cent higher than August of 2015 while sales in the condominium market were virtually the same as the same month last year.
The median price of freehold properties increased by 17 per cent over the same month last year while the median price for condominium properties increased by 19.4 per cent compared to the same period.
The average price of freehold properties showed an increase of 5.1 per cent compared to August of last year; the average sale price in the condominium market increased by 19.3 per cent when compared to the same period.
Average sale price is based on the total dollar volume of all properties sold through the RAHB MLS® System. Average sale price can be useful in establishing long term trends, but should not be used as an indicator that specific properties have increased or decreased in value. Contact a REALTOR® for information about your area or property.
The average days on market decreased from 35 to 27 days in the freehold market and from 38 to 27 days in the condominium market, compared to August of last year.
“The average days on market for residential properties (27) has increased a bit from the 22 to 25 days seen April through July, and that’s a seasonal trend,” noted RAHB President Kim Alvarez. “What is noteworthy, however, is that those numbers compare to 28 to 36 average days on market last year for those same months. Properties are moving much more quickly this year.”
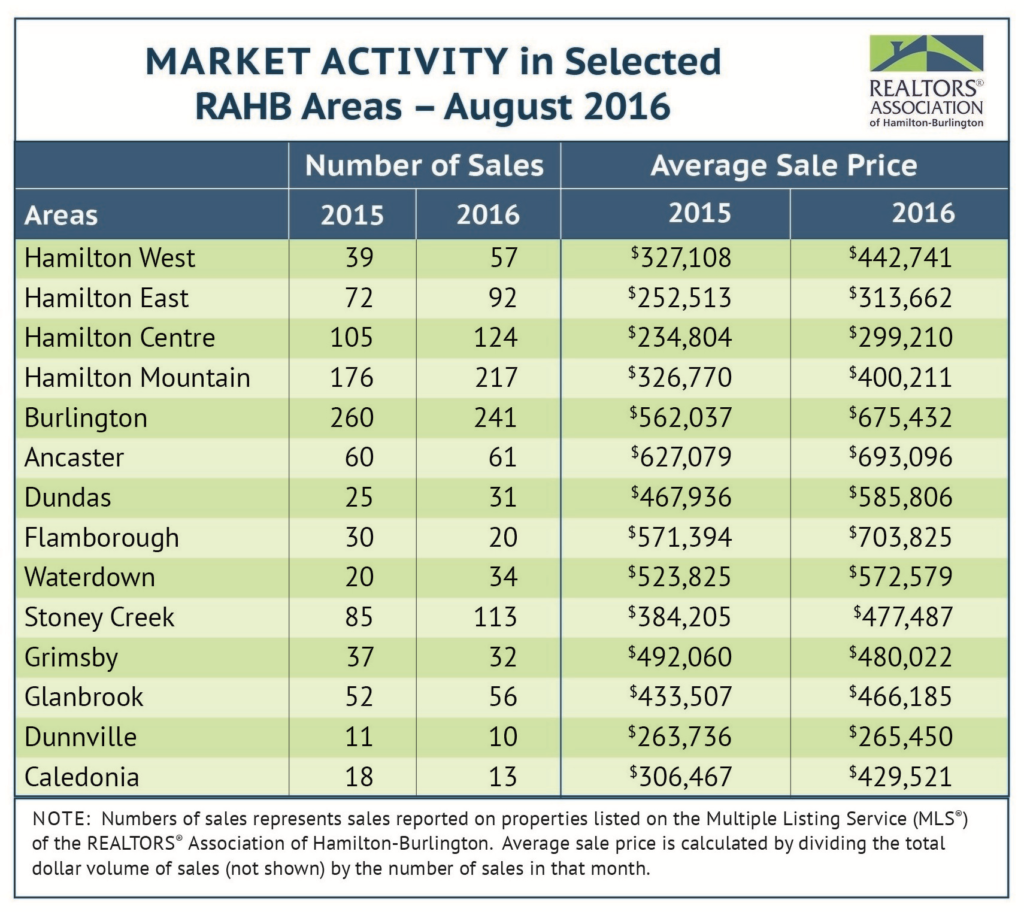
Every community in RAHB’s market area has its own localized market. Please refer to the accompanying chart, and contact a REALTOR® for more information.
*Seasonal adjustment removes normal seasonal variations, enabling analysis of monthly changes and fundamental trends in the data.
About the Realtors® Association of Hamilton-Burlington
Established in 1921, the REALTORS® Association of Hamilton-Burlington (RAHB) represents more than 2,950 real estate brokers and sales representatives from Hamilton, Burlington and outlying areas. Members of the Association may use the REALTOR® trademark, which identifies them as real estate professionals who subscribe to a strict code of ethics. The Association operates the local Multiple Listing Service® (MLS®) System and provides ongoing professional education courses for its members. Advertisements of local MLS® property listings and information about the services provided by a REALTOR® can be found at REALTOR.ca. More information about RAHB is available at rahb.ca.
Oct 5, 2016 | MLS®, Stats & Technology |
Oct 5, 2016 | MLS®, Stats & Technology |
RAHB Average Price by District – (#) Residential Unit Sales
Hamilton
Hamilton West, 10 – 12
Hamilton East, 23, 24, 27 – 29
Hamilton Centre, 13, 14, 20 – 22
Hamilton Mountain, 15 – 18, 25 & 26
Burlington 30 – 36, 38
Outlying
Flamborough, 40, 43 – 45
Dundas, 41
Ancaster, 42
Waterdown, 46
Stoney Creek, 50 – 52
Glanbrook, 53
Grimsby, 54 -55
West Lincoln, 56
Smithville, 57
Dunnville, 61
Cayuga, 62
Calendonia/Hagersville, 63 & 70
Onieda/Seneca, 71 & 64
Rainham, 65
Canborough/Dunn, 60

 *Seasonal adjustment removes normal seasonal variations, enabling analysis of monthly changes and fundamental trends in the data.


