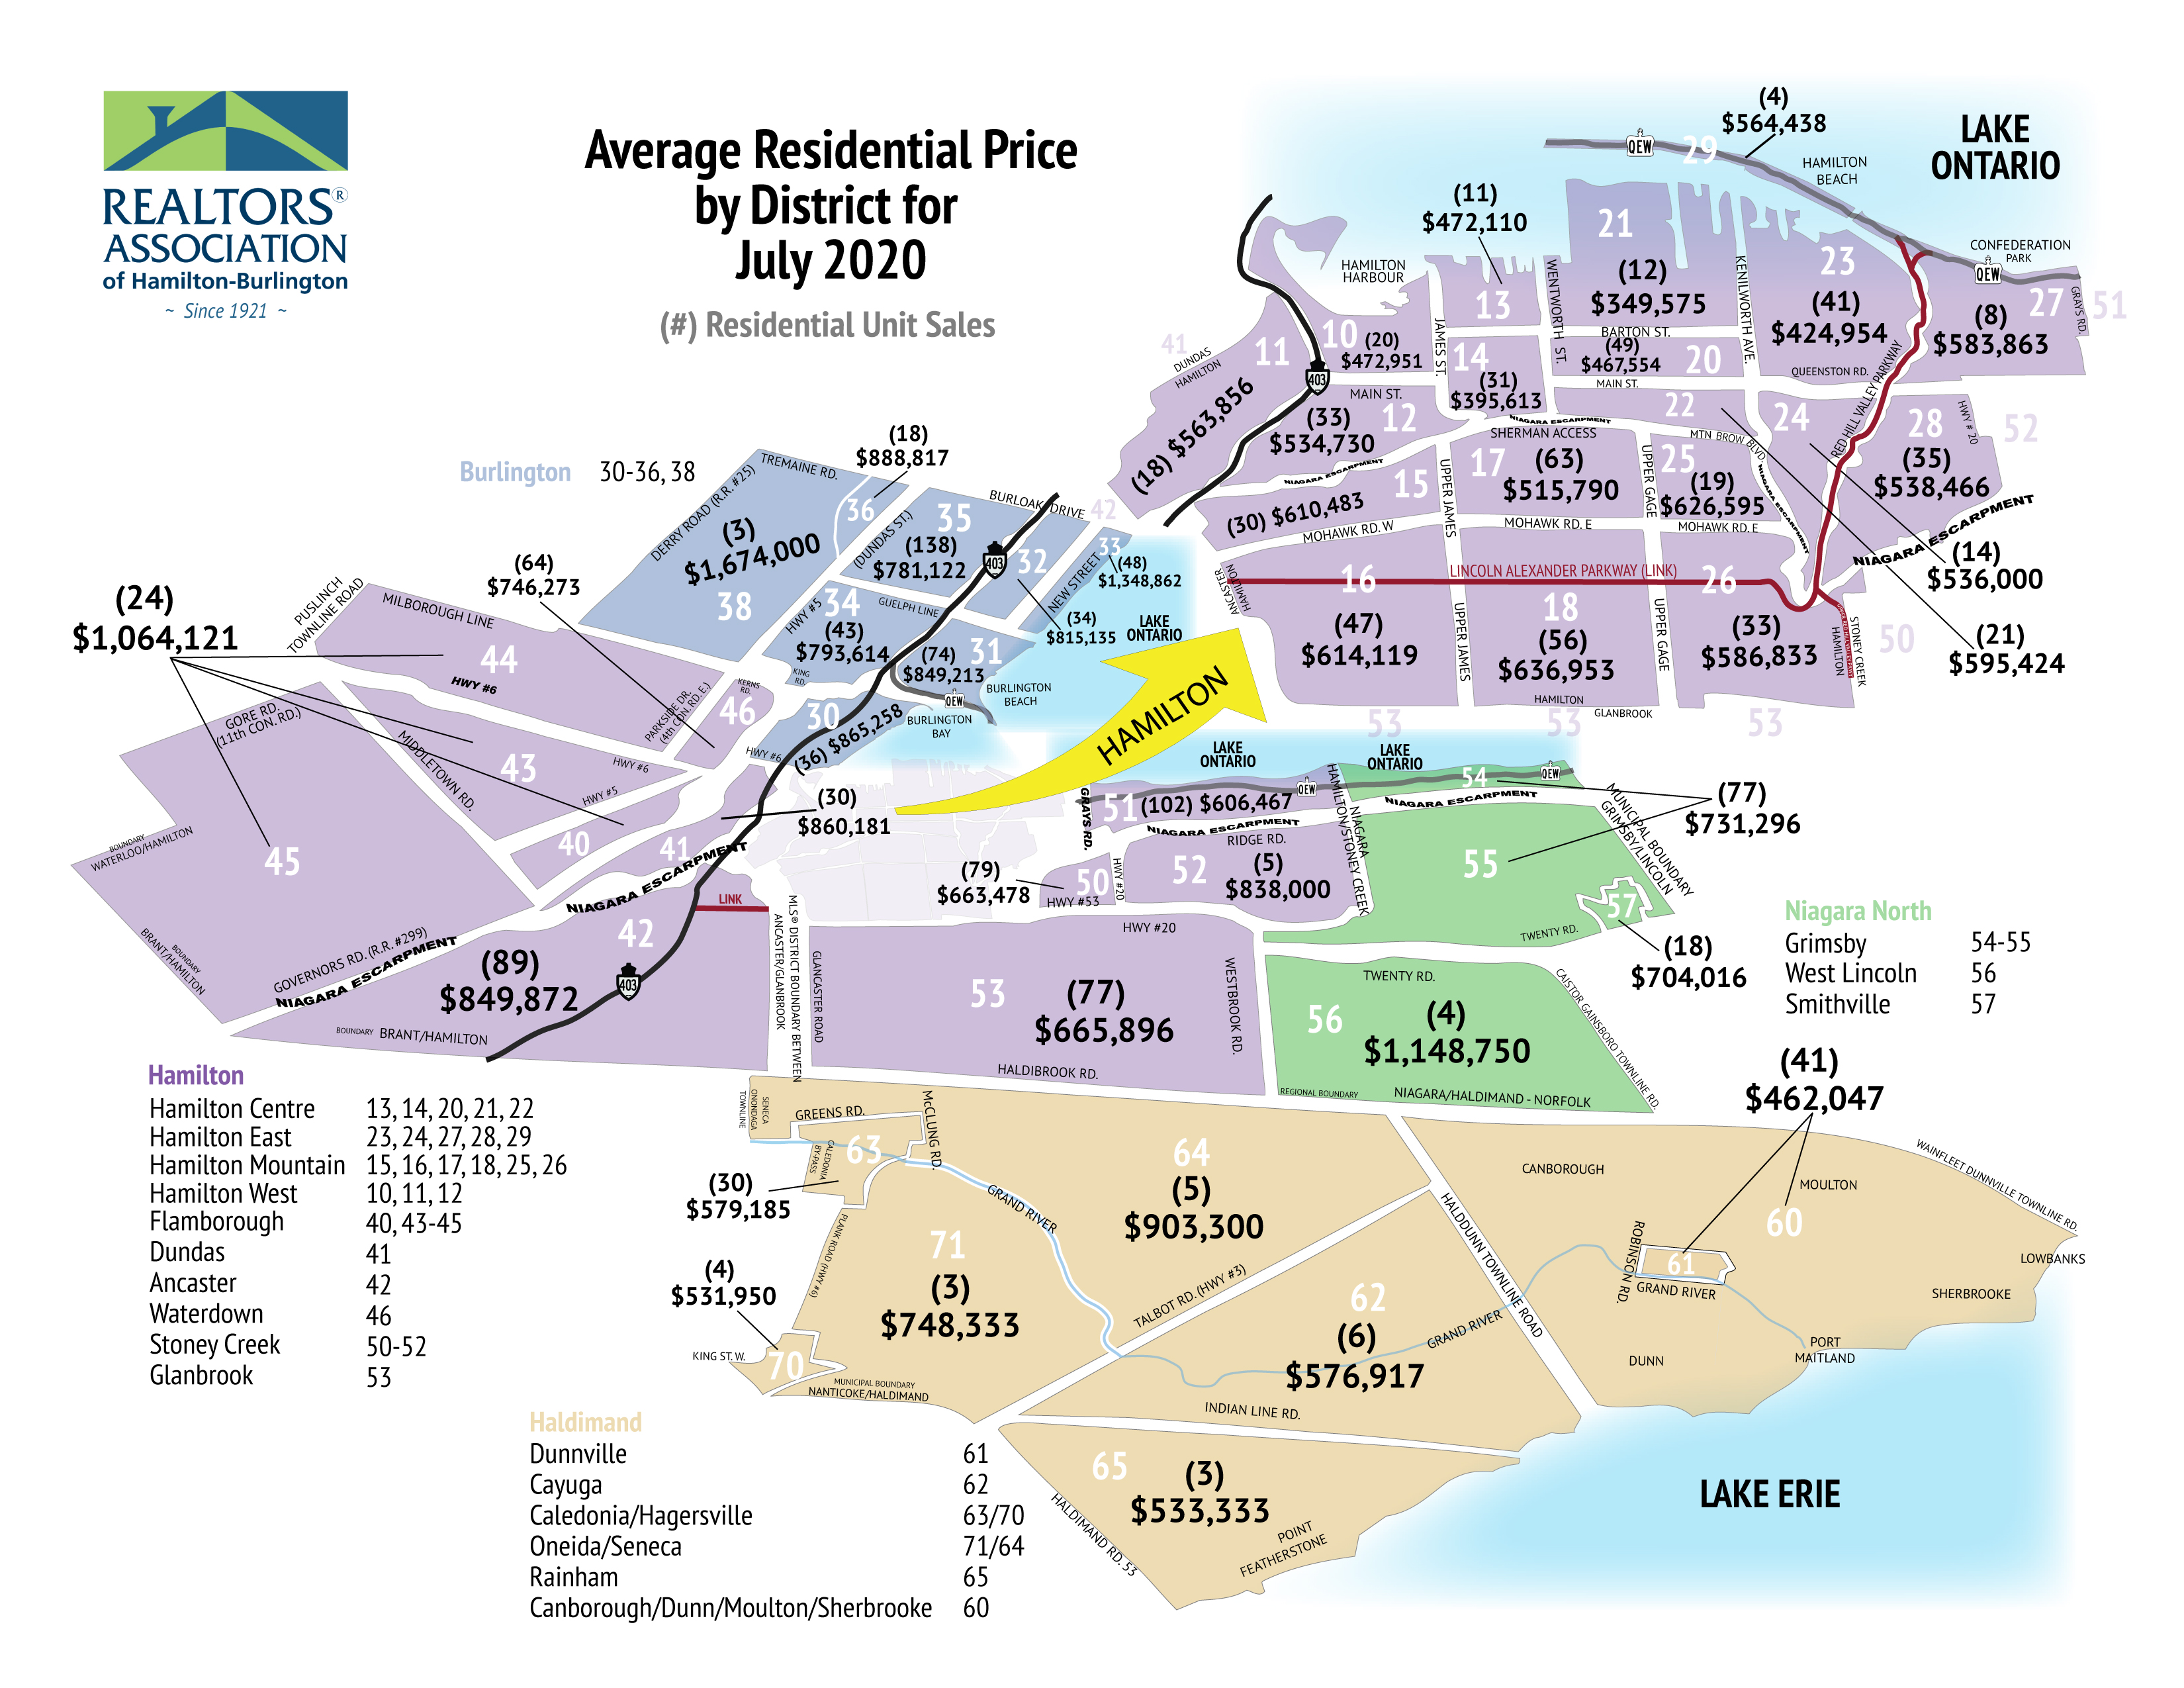
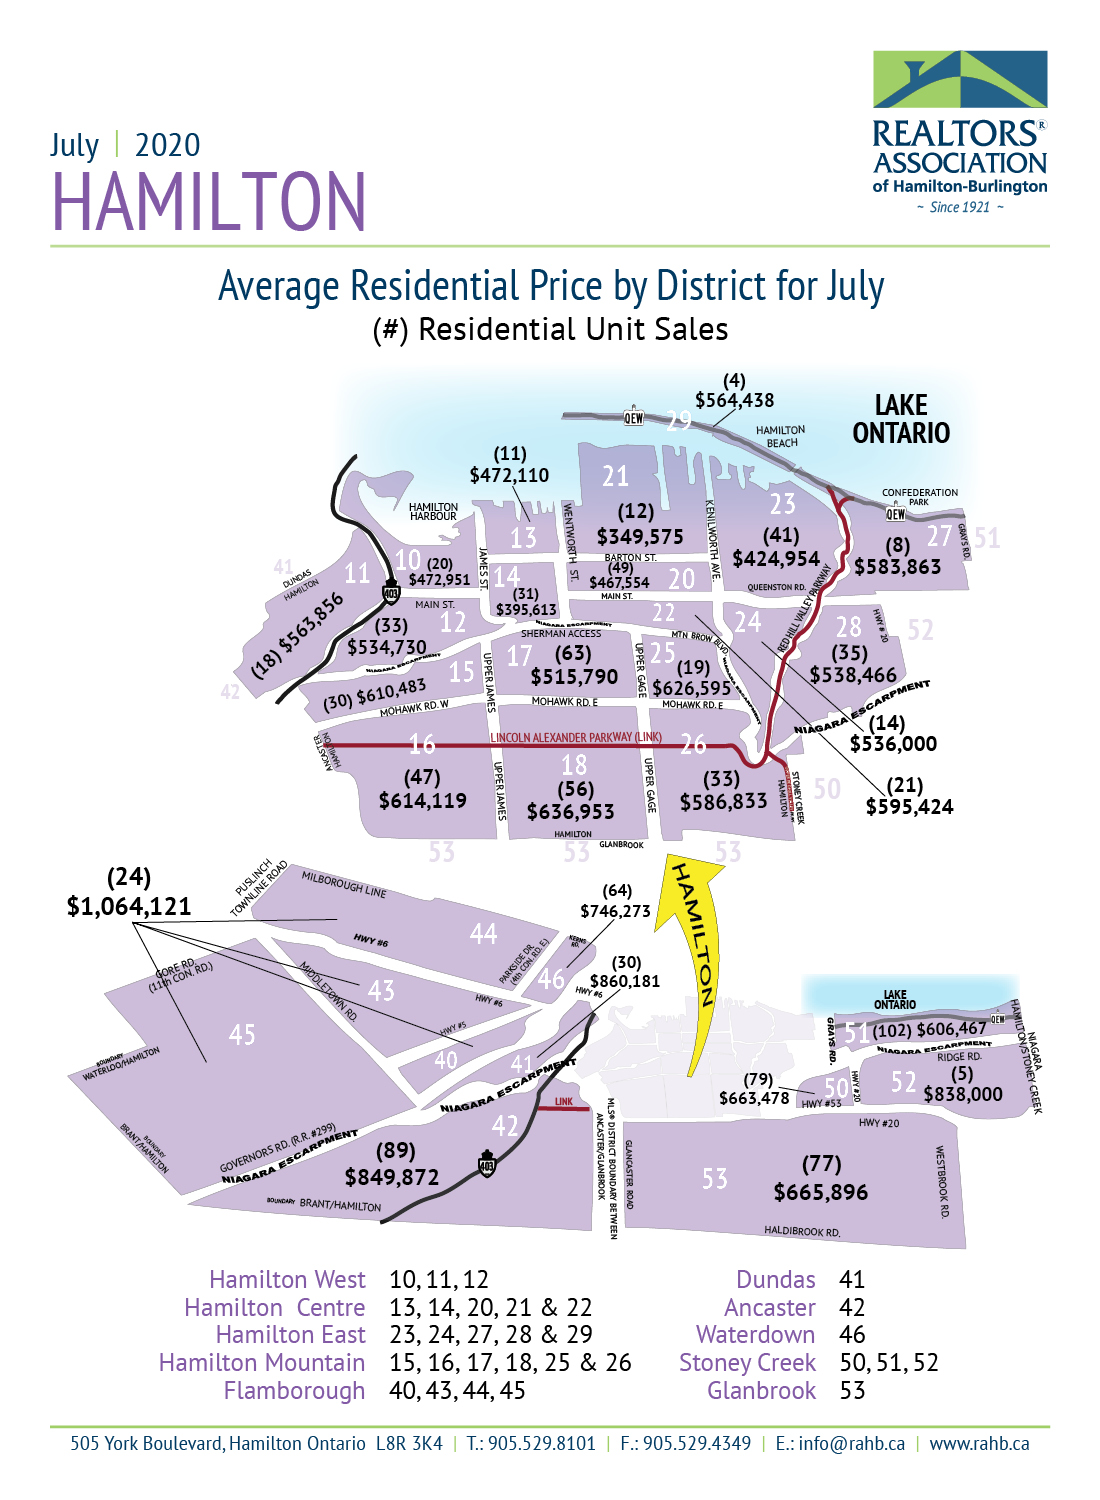
The REALTORS® Association of Hamilton-Burlington (RAHB) reported 1,613 sales of residential properties located within the RAHB market area were processed through the Multiple Listing Service® (MLS®) System in July 2020. Sales are up 23.7 per cent over last month and up 27.8 per cent over July of last year. New listings are up 15.5 per cent over June 2020 and up 8.8 per cent over last July. The average price for residential properties was $692,999, which is up 2.6 per cent from last month and up 16.3 per cent from July 2019. The number of active listings for the month was down 21.4 per cent over last year.
*The news release will be posted to www.rahb.ca/market-stats/ on Wednesday, August 5.*
Follow the links below for:
- Residential Market Activity for RAHB Area
- All RAHB Residential Market Activity and HPI Report (17 pages)
- RAHB Residential Market at a Glance
- Weekly Trends for March, April, May, June and July *NEW*
- Social Media Stats Kit
- Stats Map for Entire RAHB Area
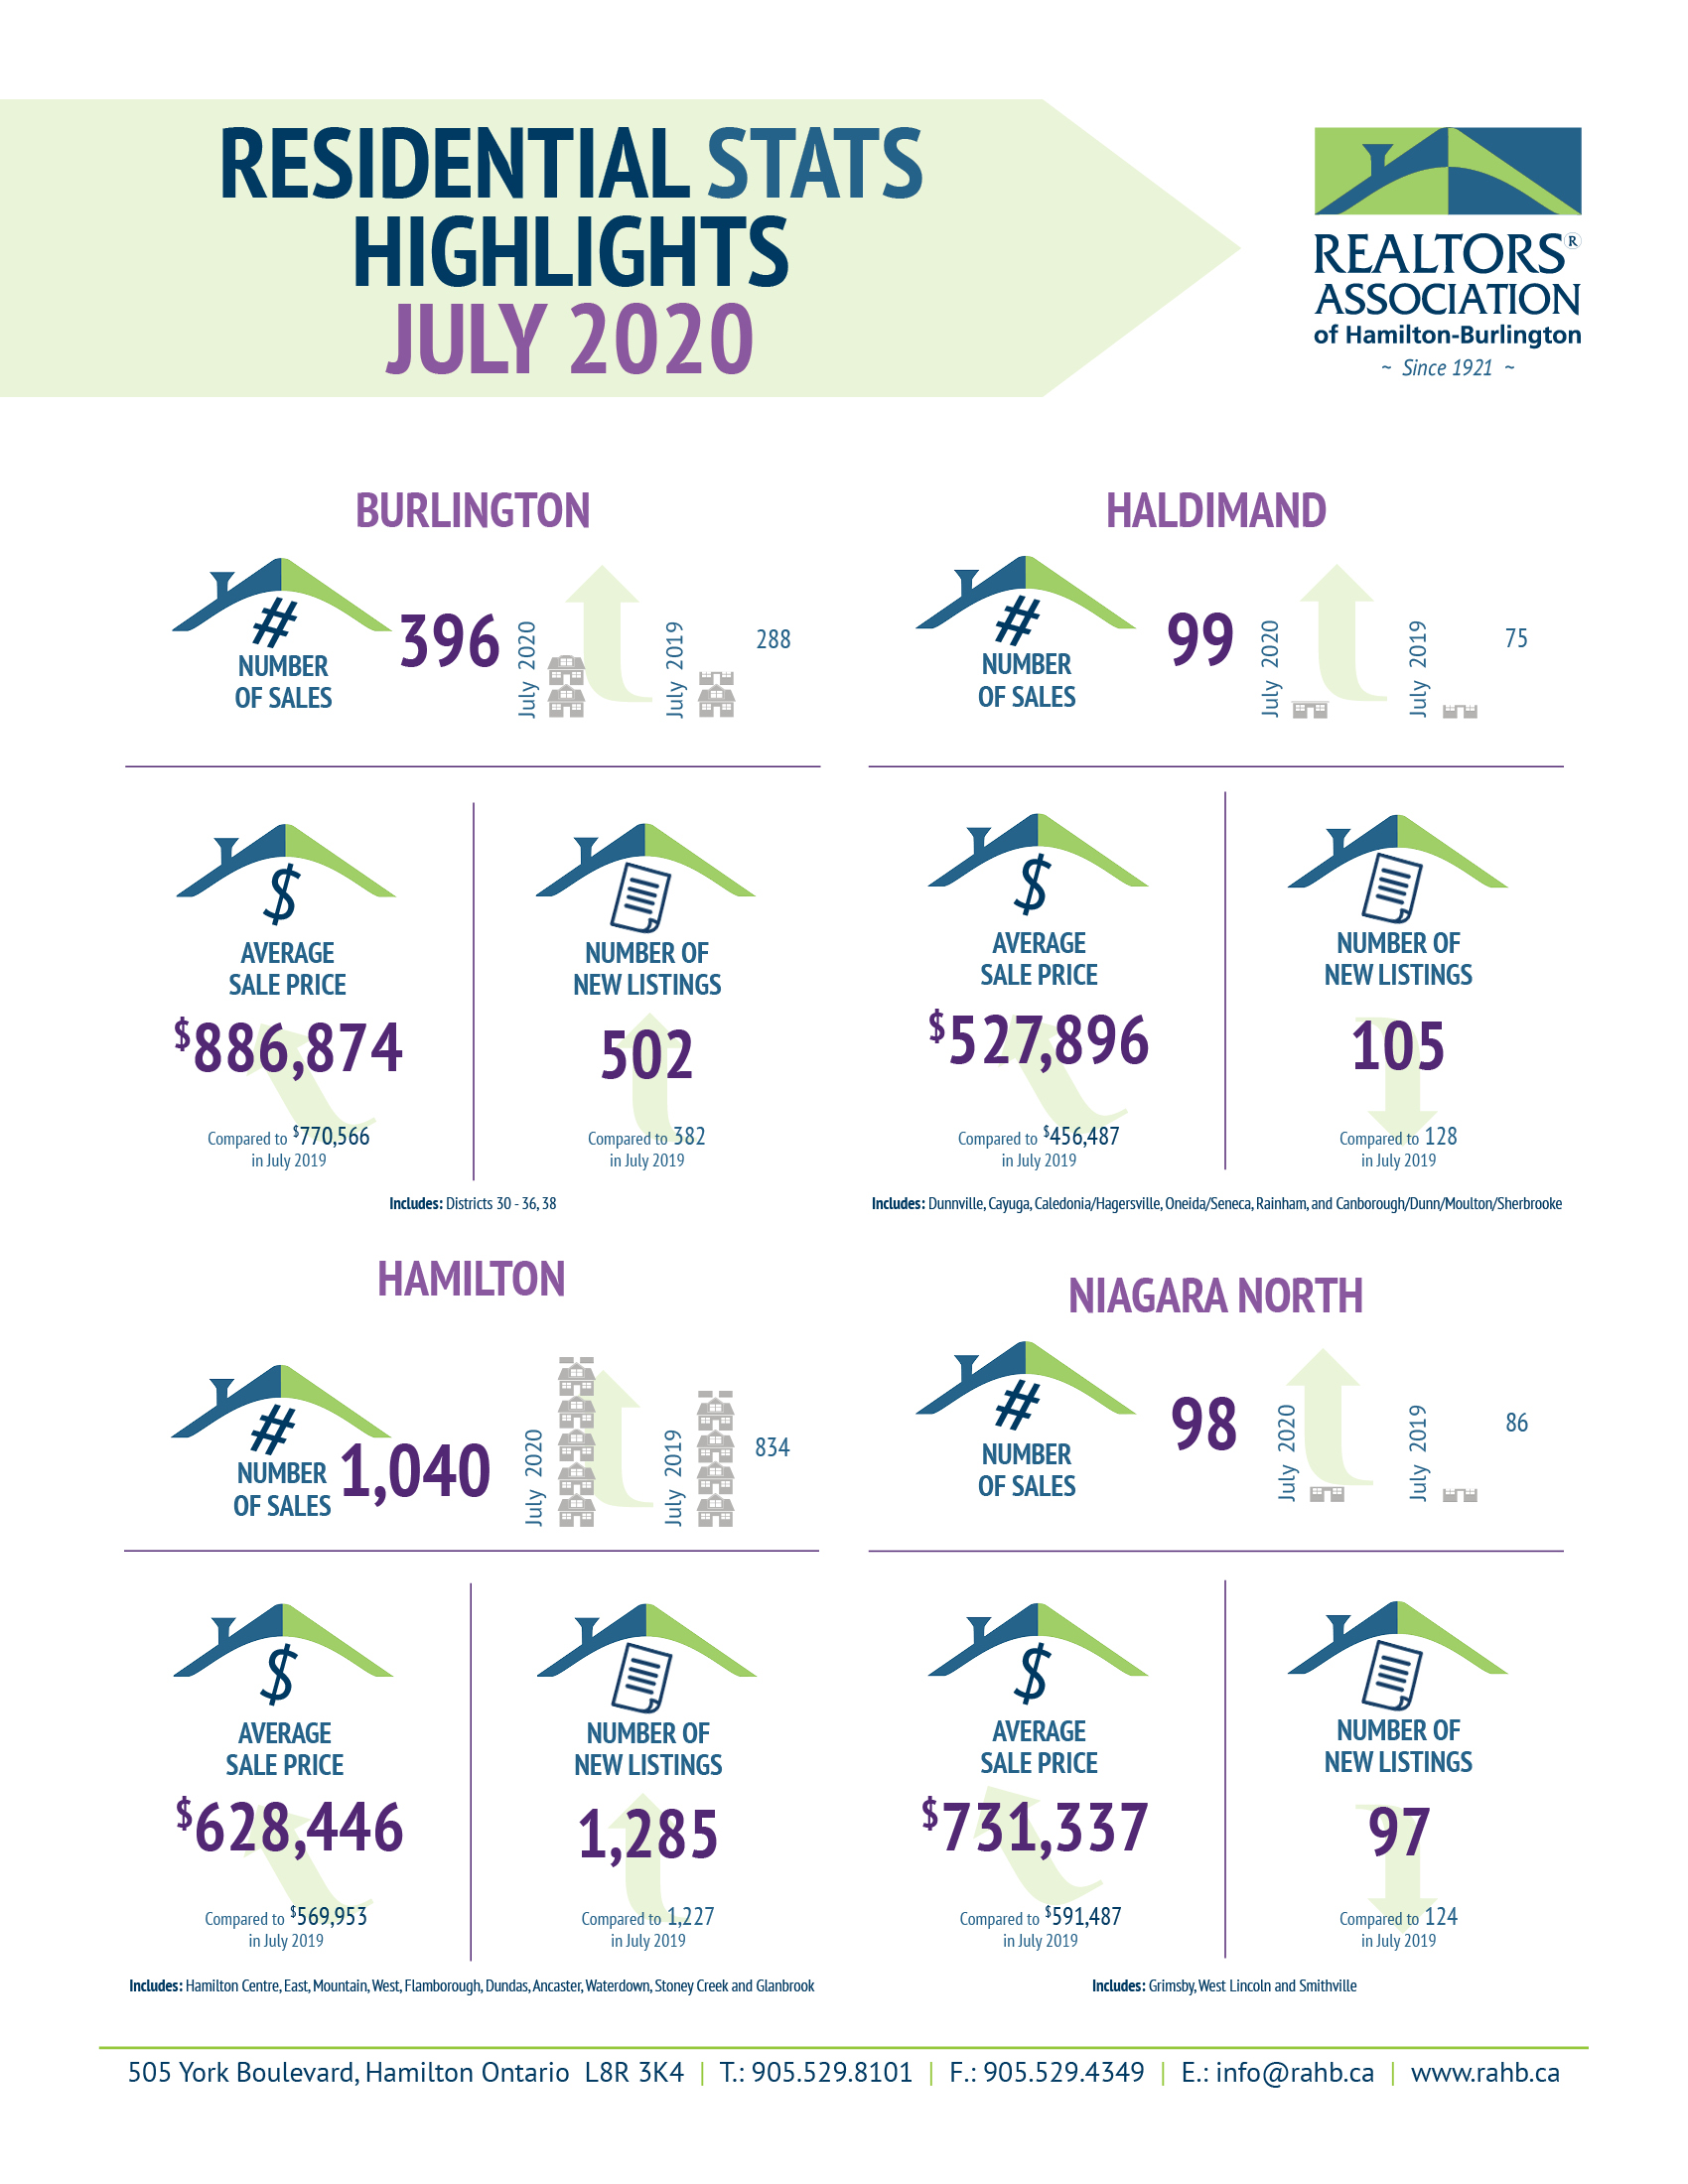
- Market Highlights *NEW*
- RAHB Commercial Activity
- Residential + Commercial Activity for RAHB Market Areas
- Historical Chart
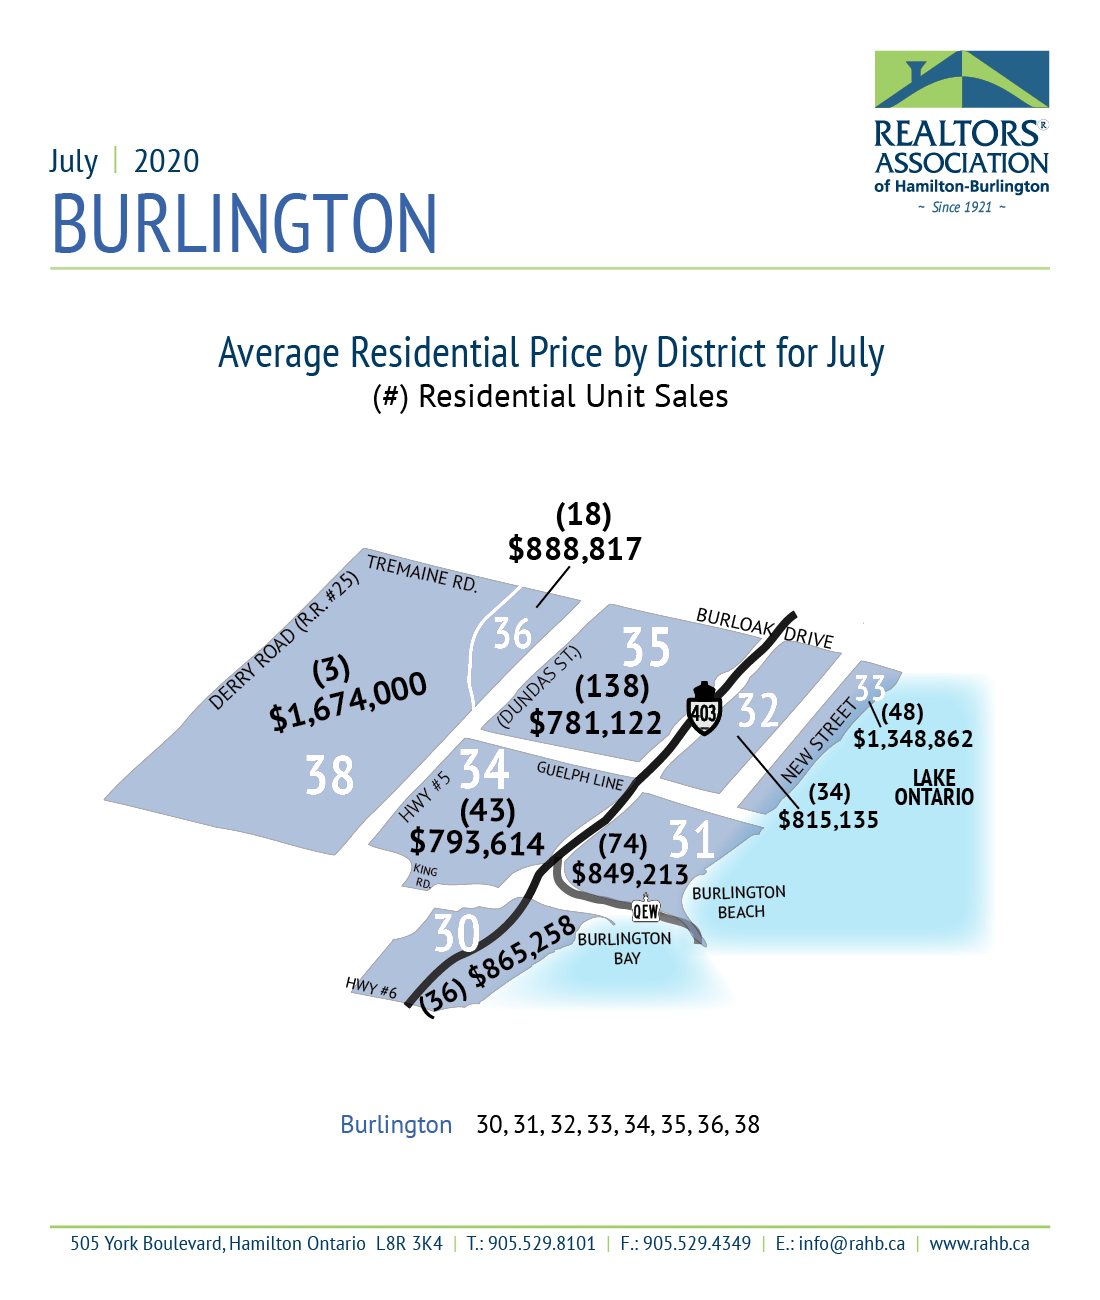
Burlington
- Residential Real Estate Market Activity Table for Burlington
- Burlington Market Activity and HPI Report (72 pages)
- Burlington Area Map
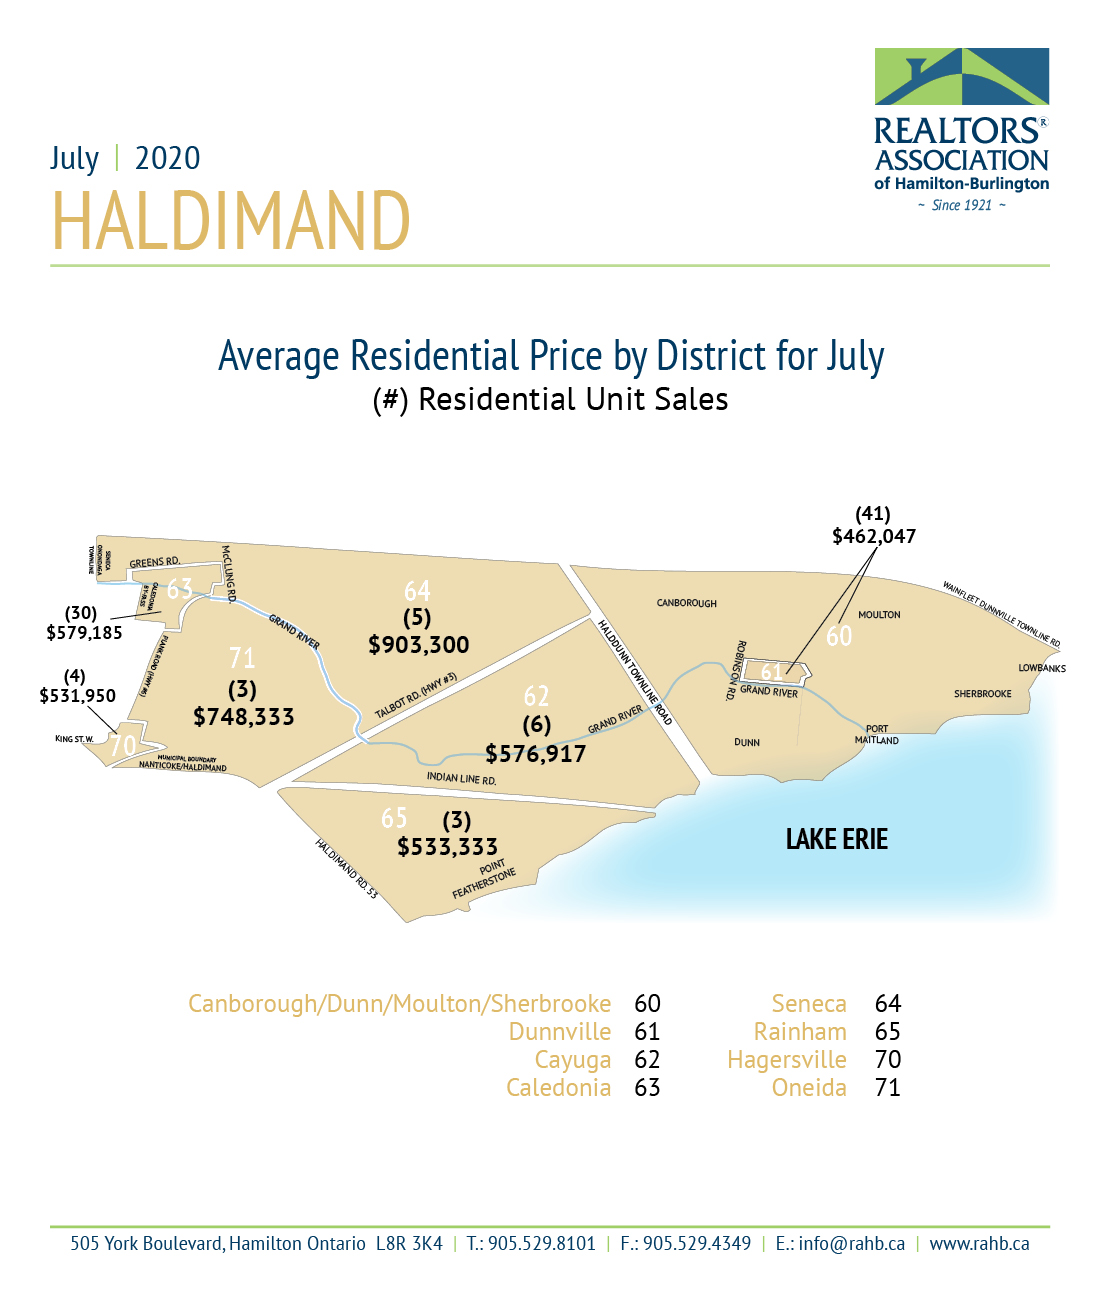
Halidmand
- Residential Real Estate Market Activity Table for Haldimand
- Haldimand Market Activity and HPI Report (58 pages)
- Haldimand Area Map
Hamilton
- Residential Real Estate Market Activity Table for Hamilton
- Hamilton Market Activity and HPI Report (197 pages)
- Hamilton Area Map
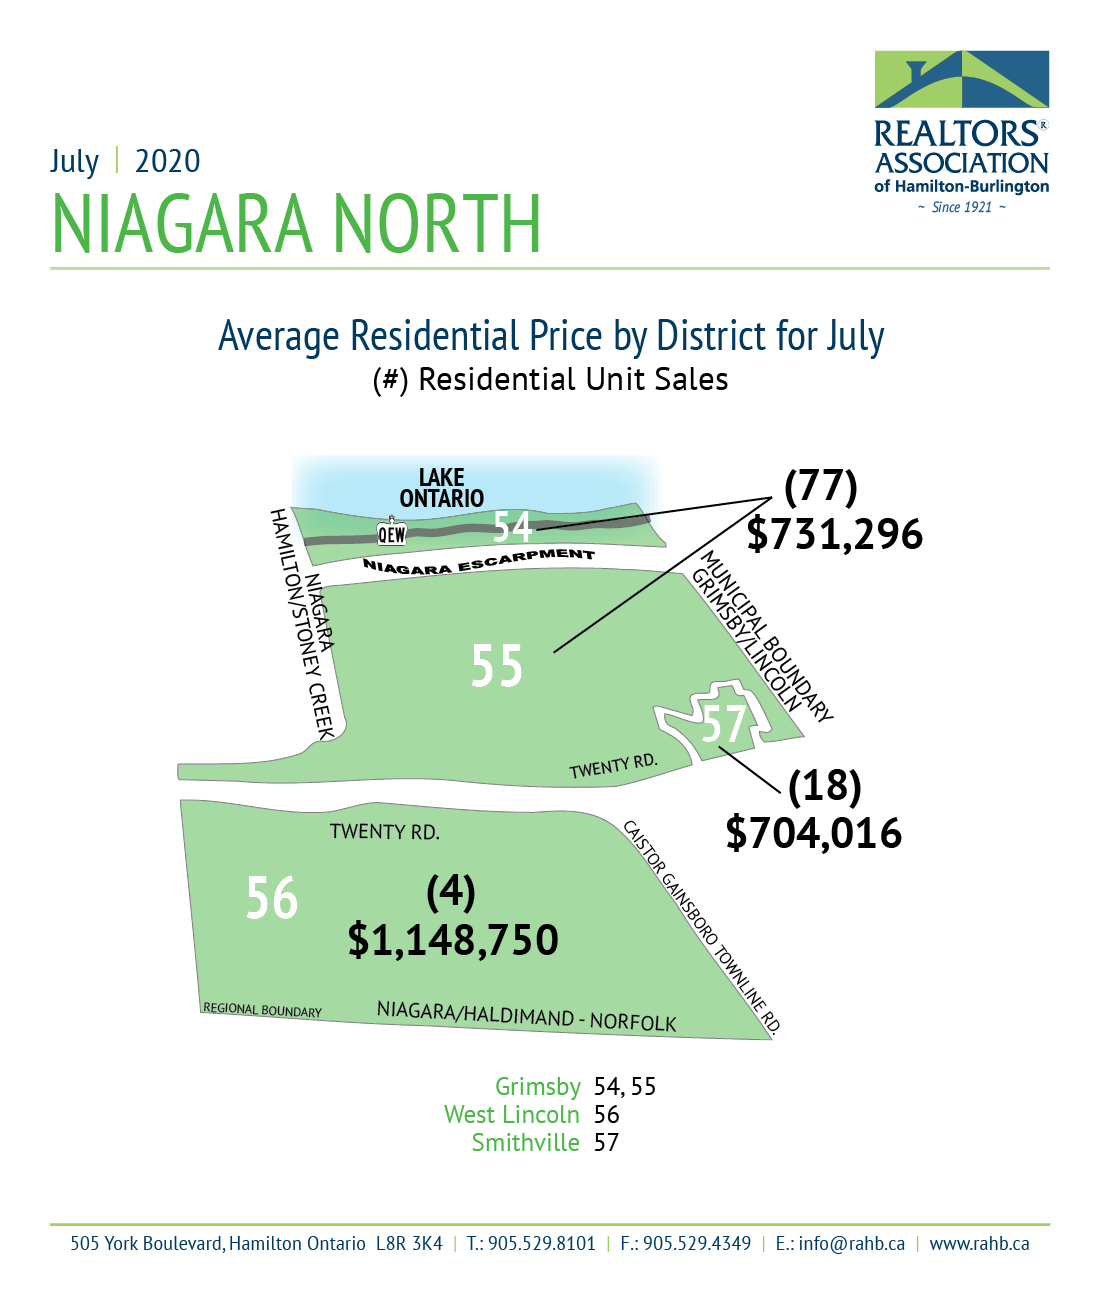
Niagara North
- Residential Real Estate Market Activity Table for Niagara North
- Niagara North Market Activity and HPI Report (31 pages)
- Niagara North Area Map