Hamilton, ON (April 1, 2019) – The REALTORS® Association of Hamilton-Burlington (RAHB) reported 1,032 sales of residential properties located within the RAHB market area were processed through the Multiple Listing Service® (MLS®) System in March, 2019. This is a 1.2 per cent drop from March last year; however, a 40 per cent increase over February 2019 and a 74 per cent increase over January 2019. The average price was up from March 2018 by 4.9 per cent to $575,099.
Please click here to read the full release.
Follow the links below for:
- Residential Market Activity for RAHB Area
- All RAHB Residential Market Activity and HPI Report (17 pages)
- RAHB Residential Market at a Glance
- Social Media Stats Kit
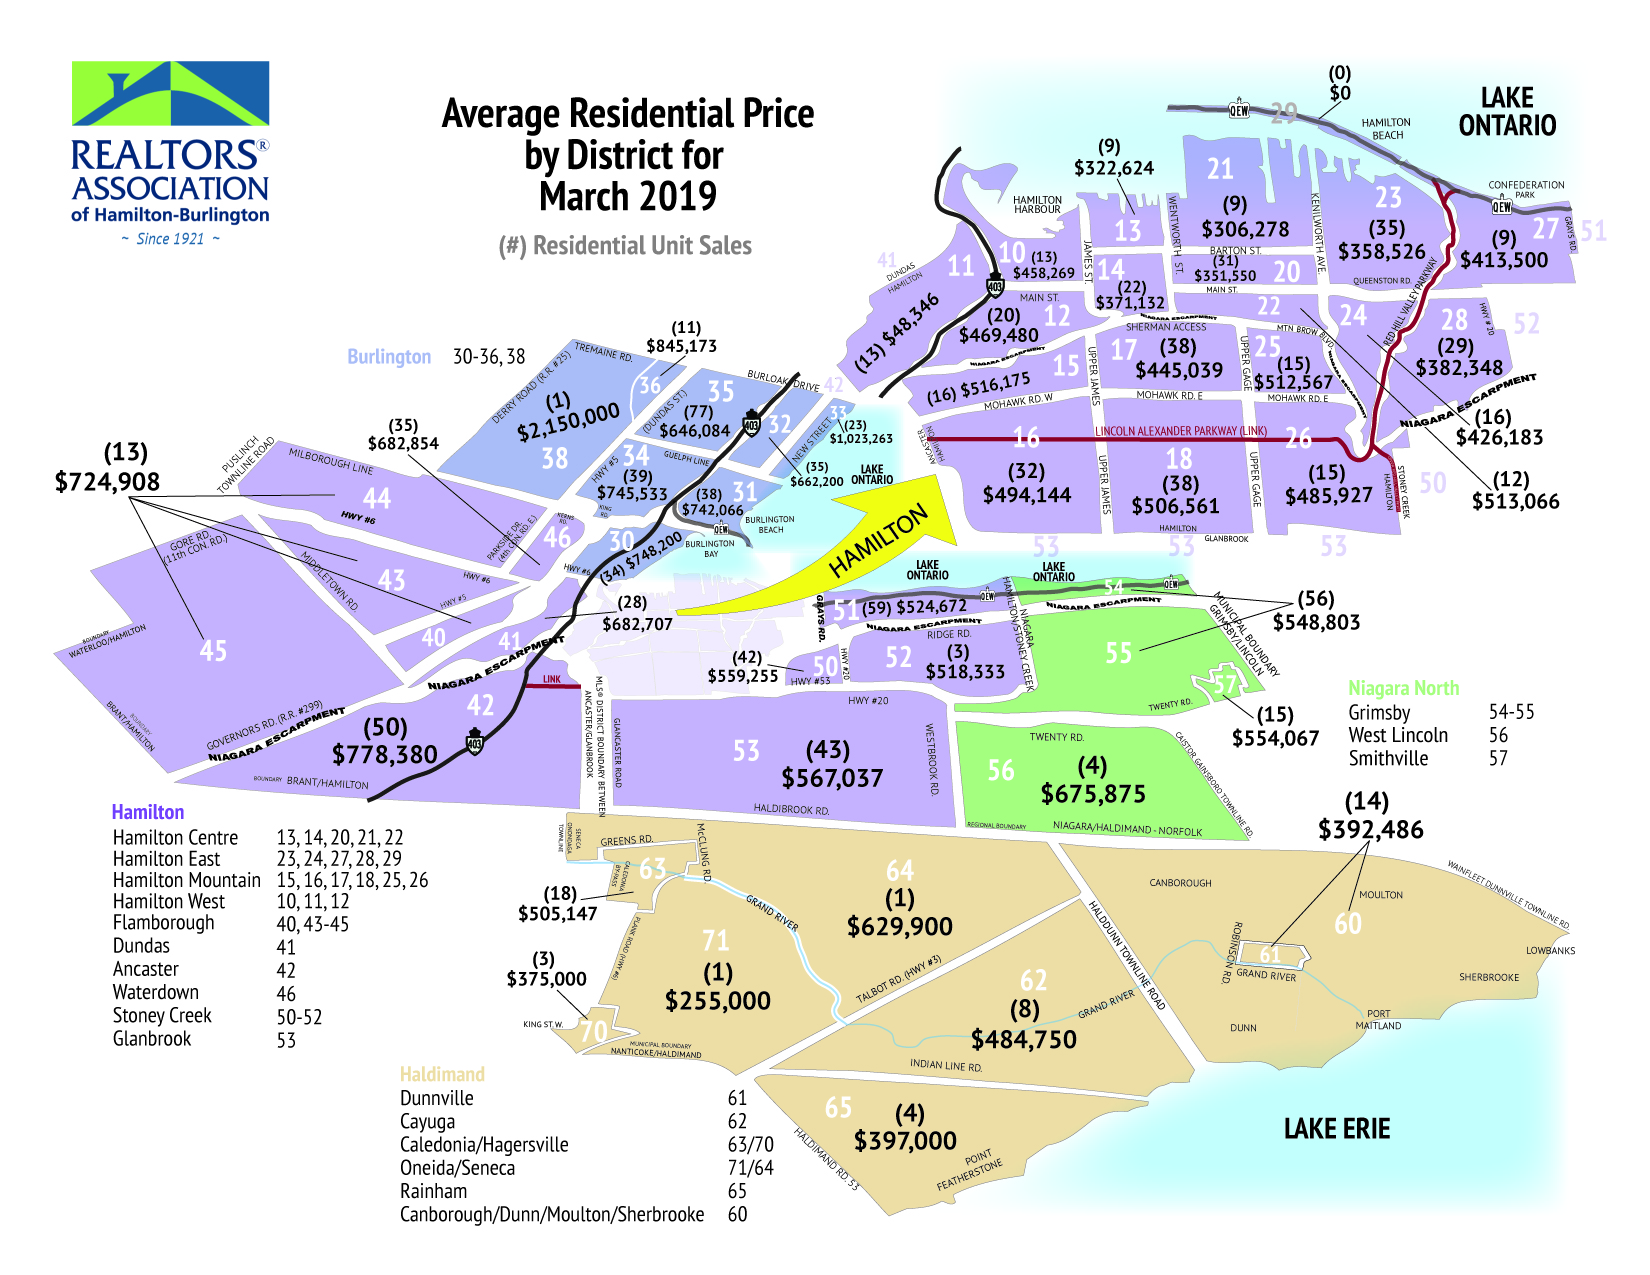
- Stats Map for Entire RAHB Area
- RAHB Commercial Activity
- Historical Chart
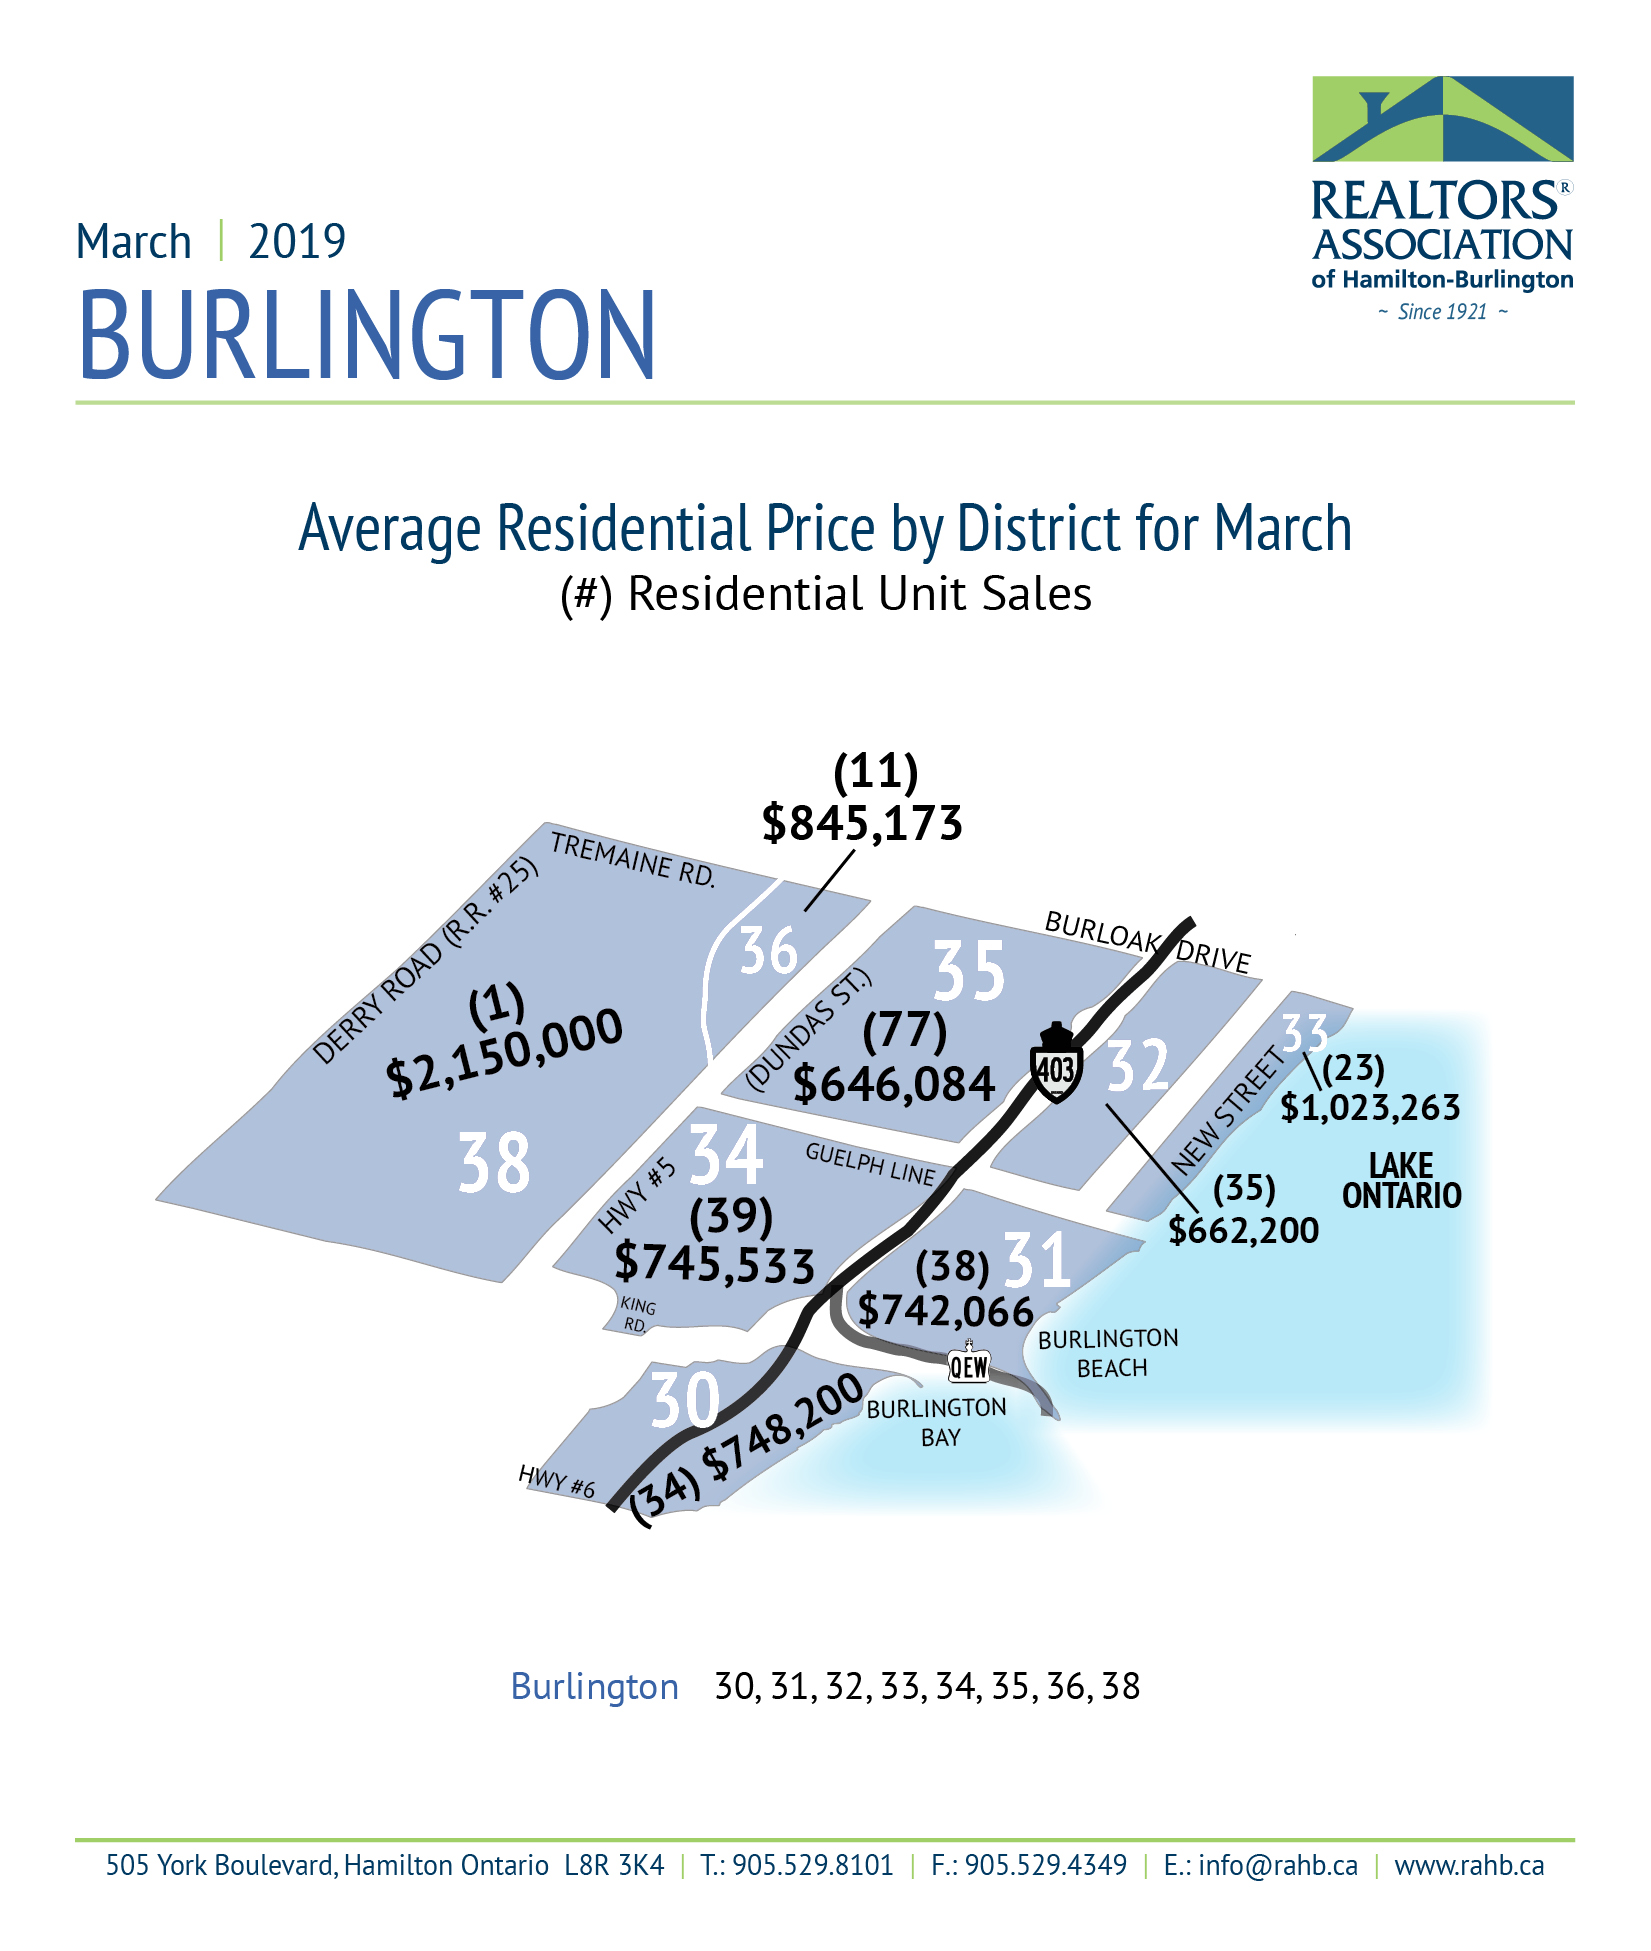
Burlington
- Residential Real Estate Market Activity Table for Burlington
- Burlington Market Activity and HPI Report (72 pages)
- Burlington Area Map
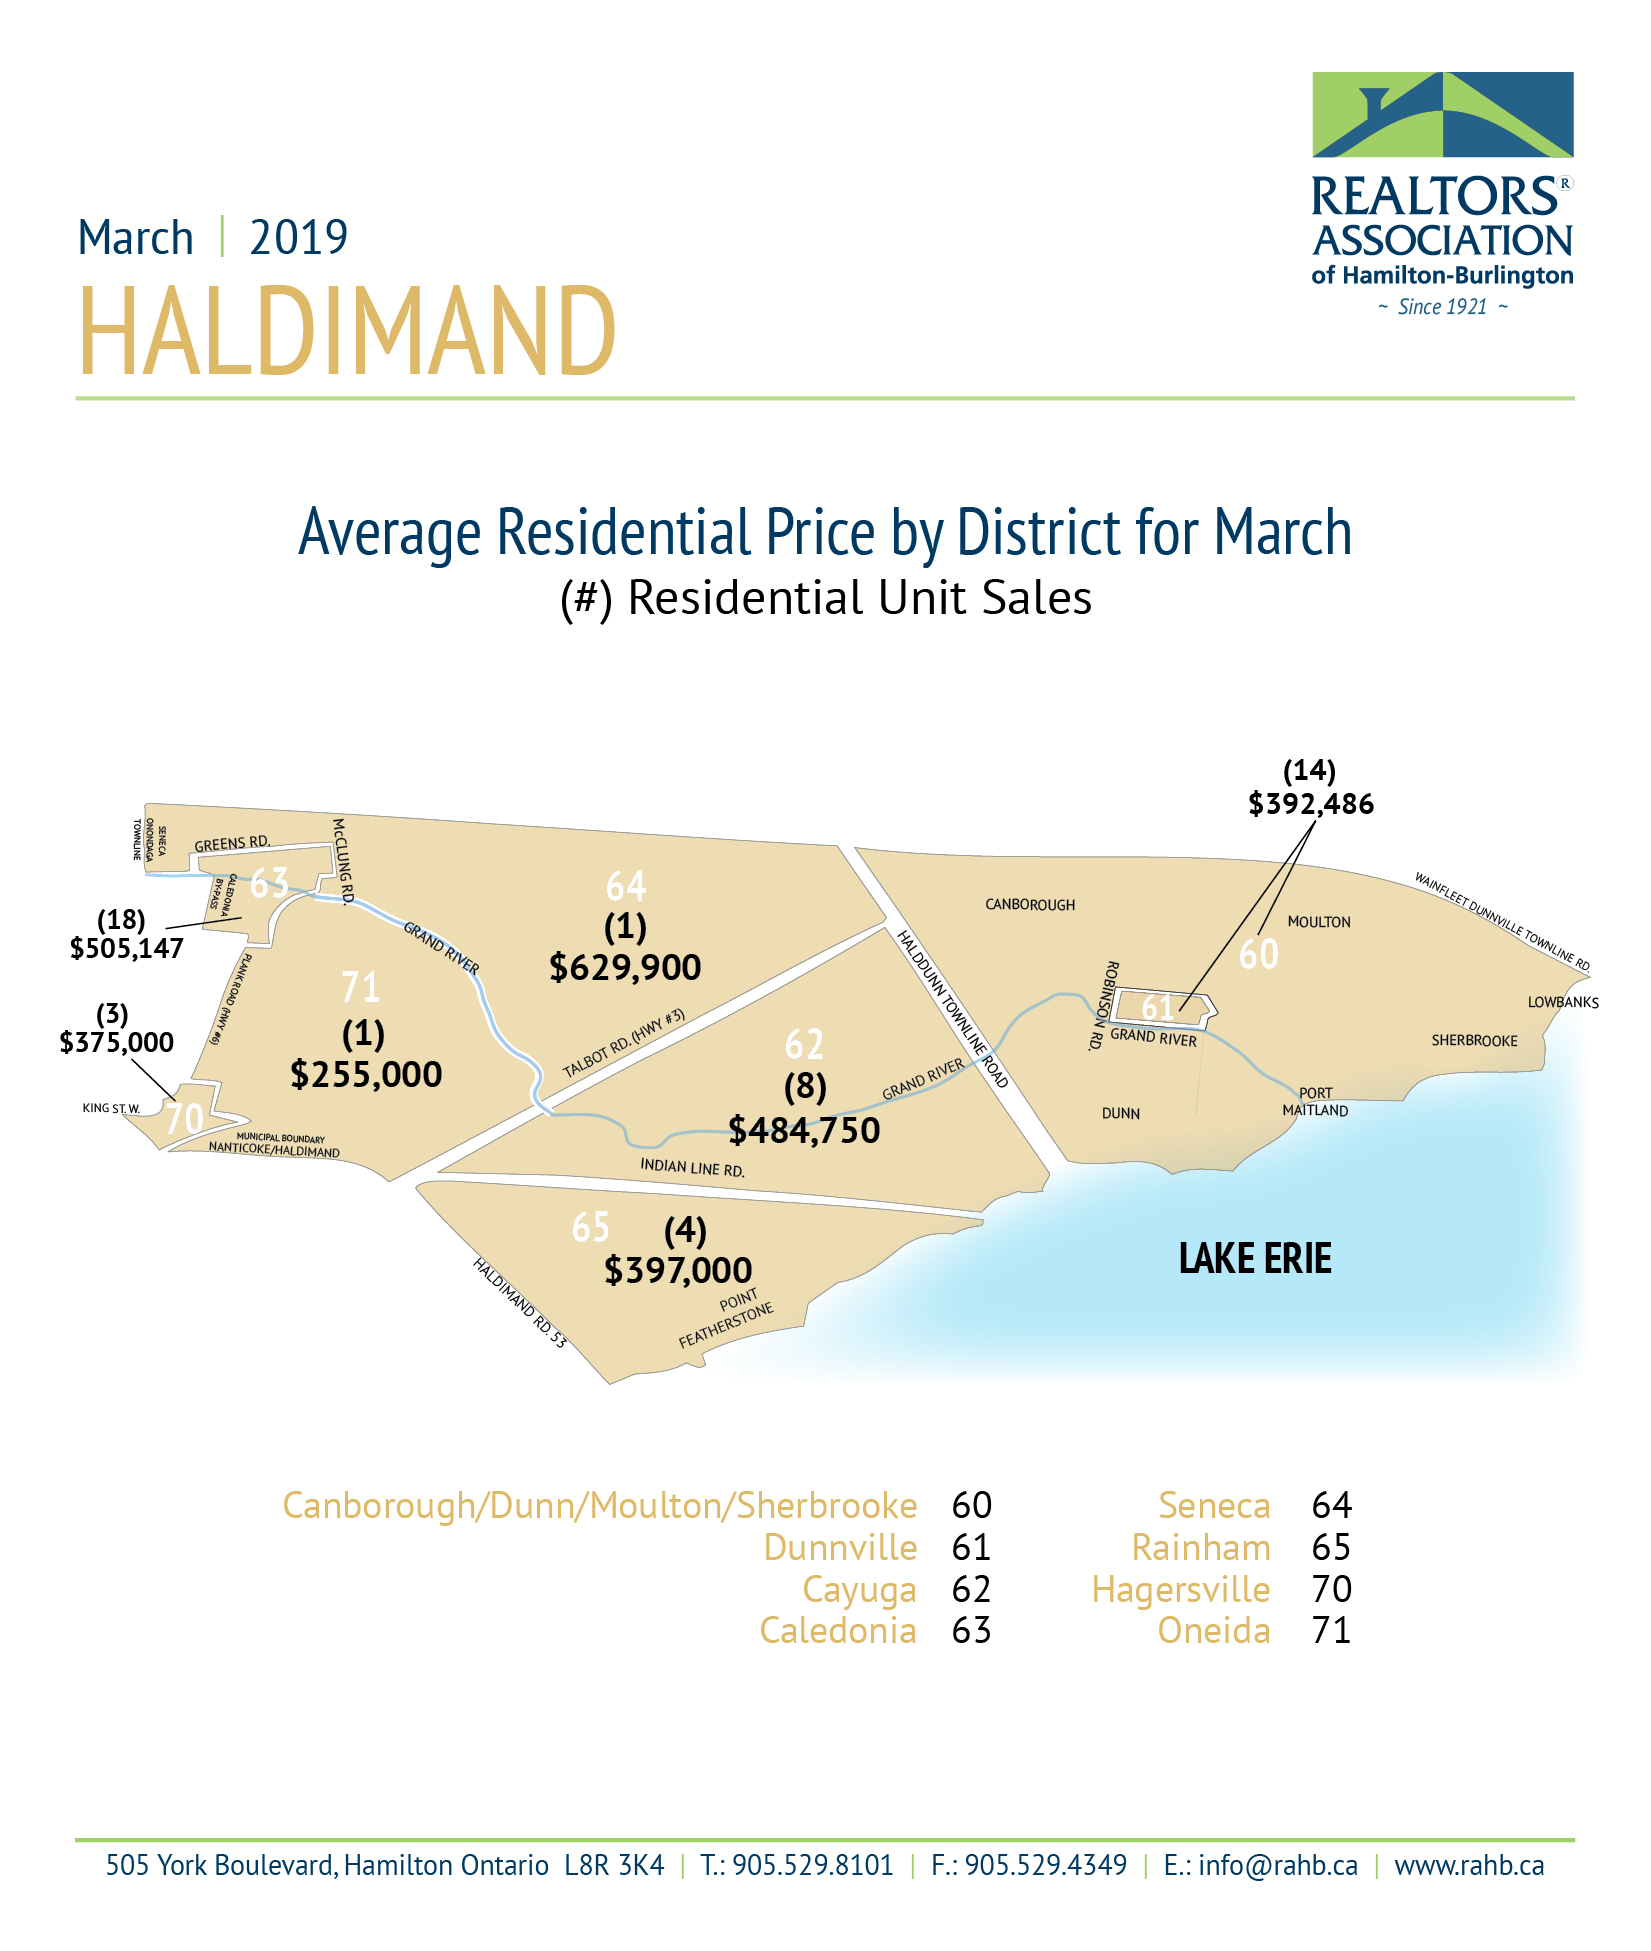
Halidmand
- Residential Real Estate Market Activity Table for Haldimand
- Haldimand Market Activity and HPI Report (62 pages)
- Haldimand Area Map
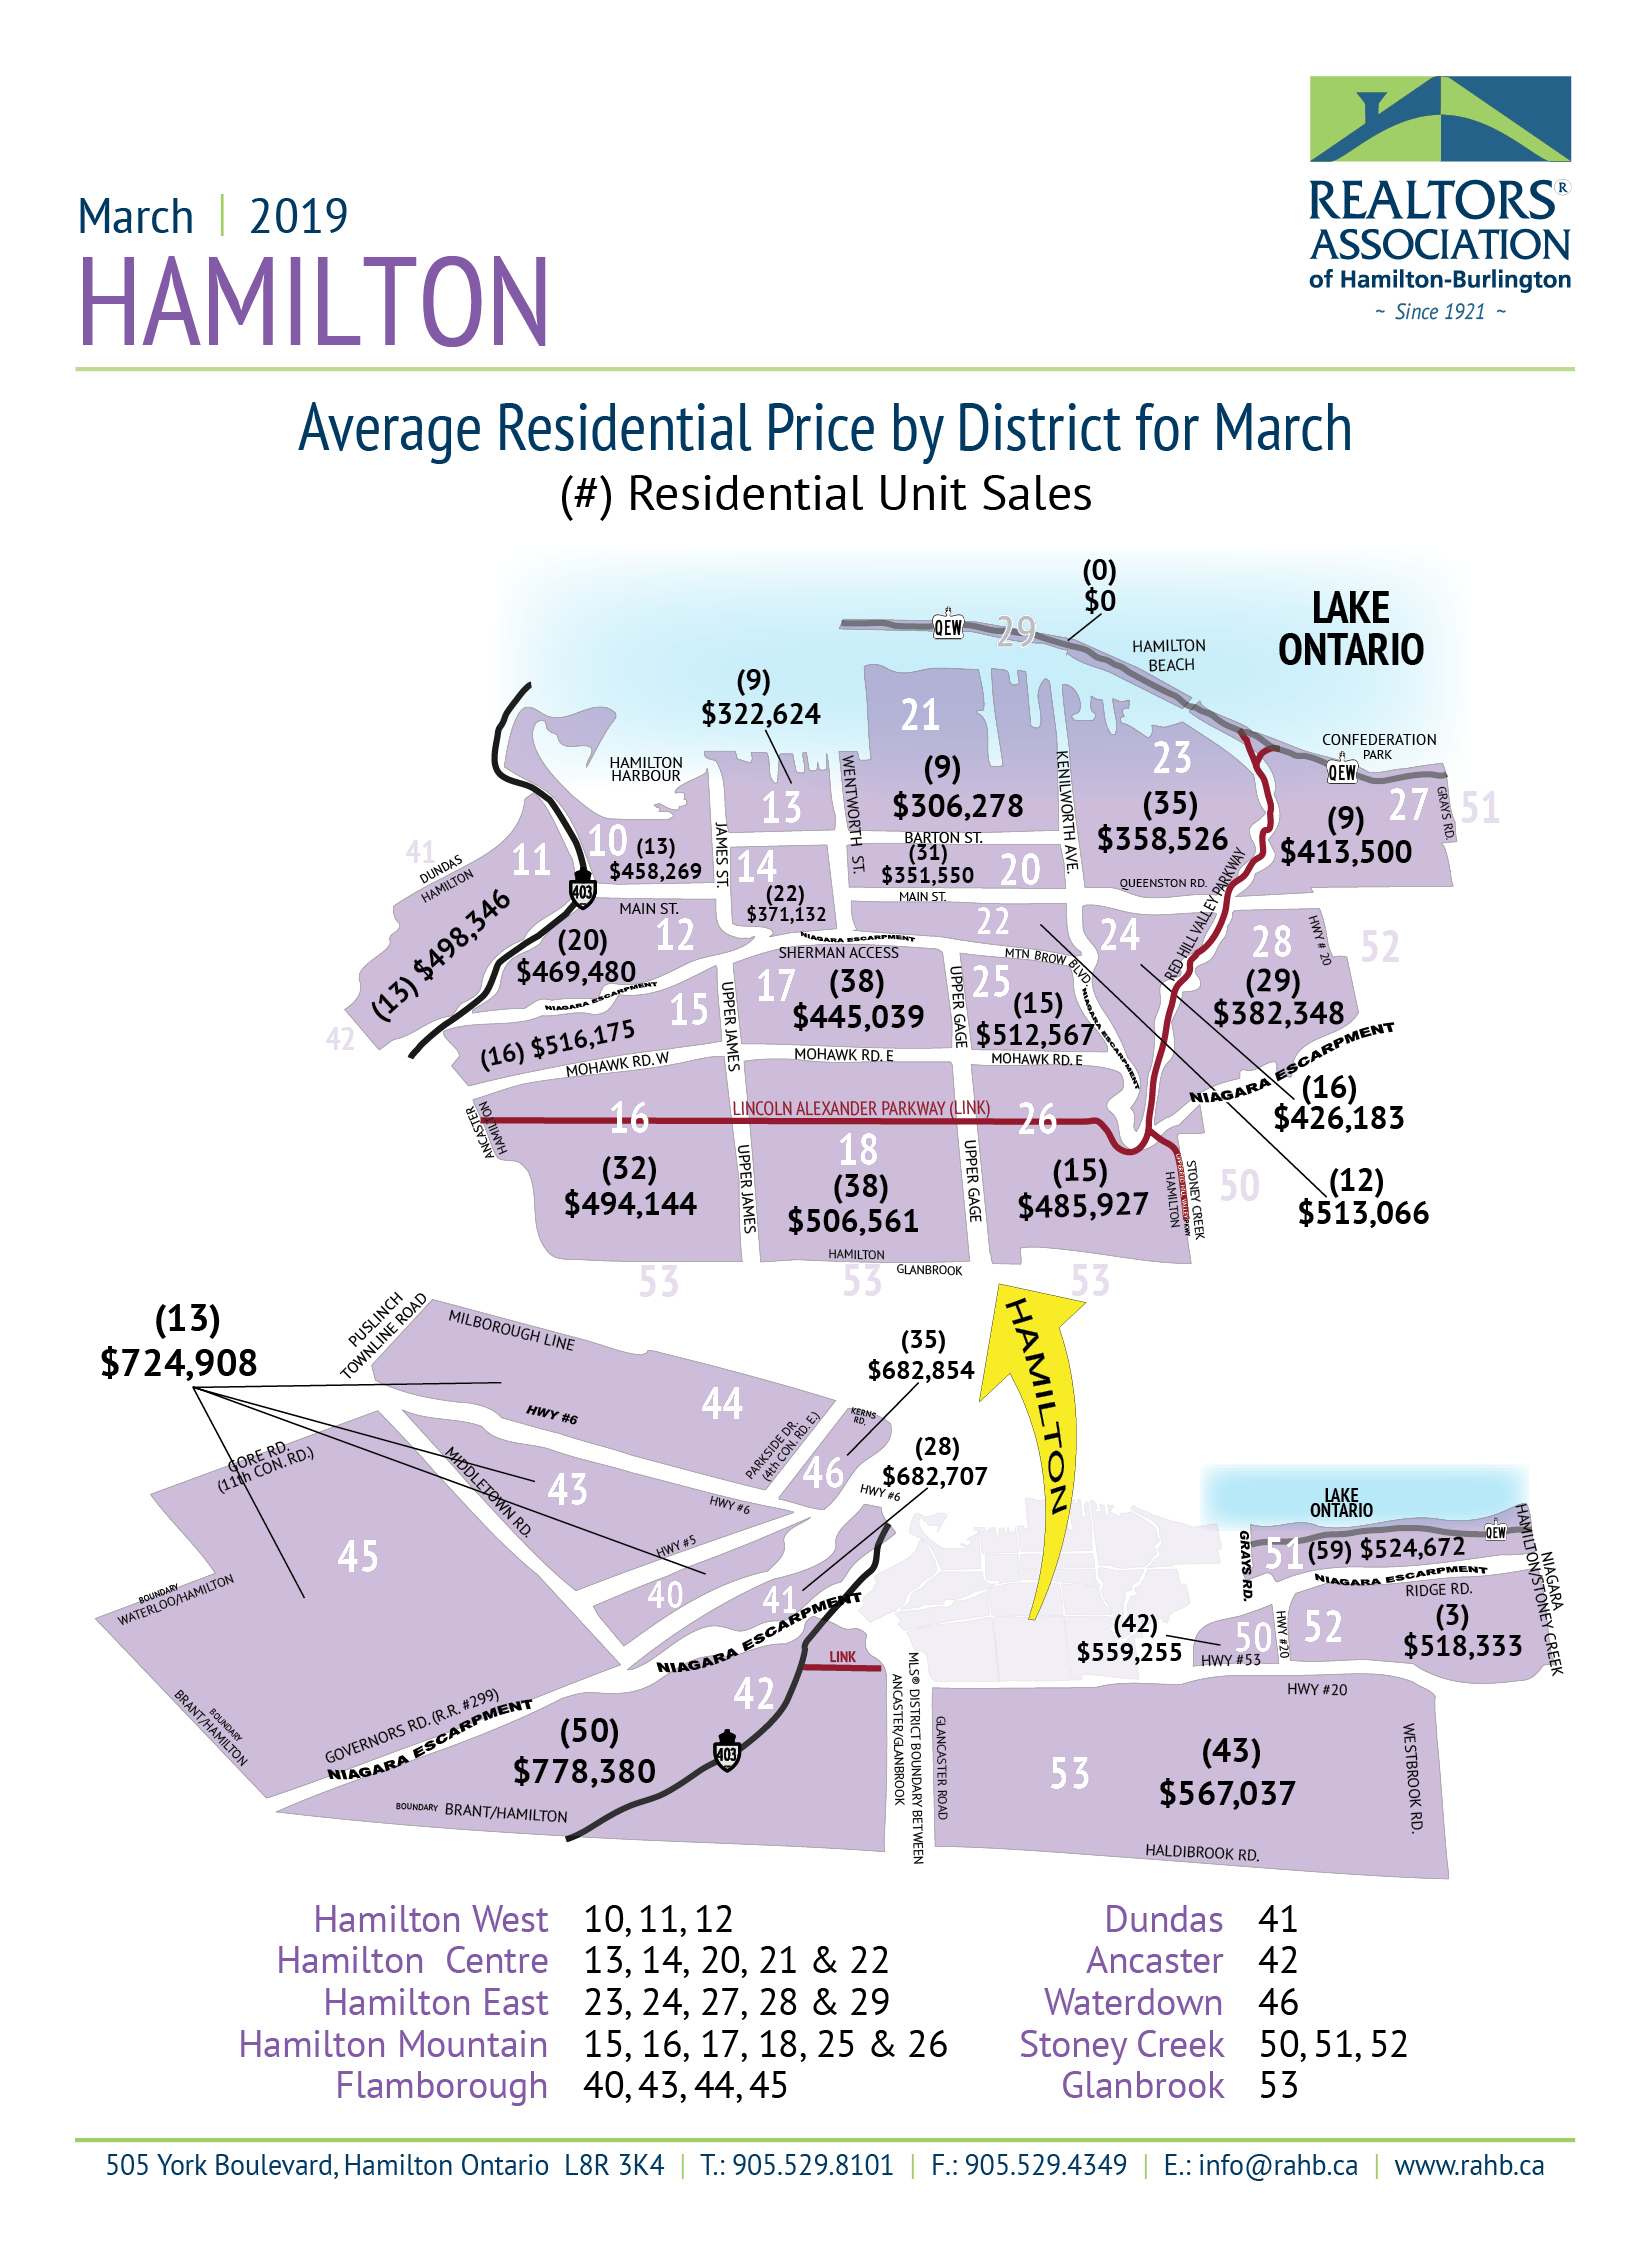
Hamilton
- Residential Real Estate Market Activity Table for Hamilton
- Hamilton Market Activity and HPI Report (199 pages)
- Hamilton Area Map
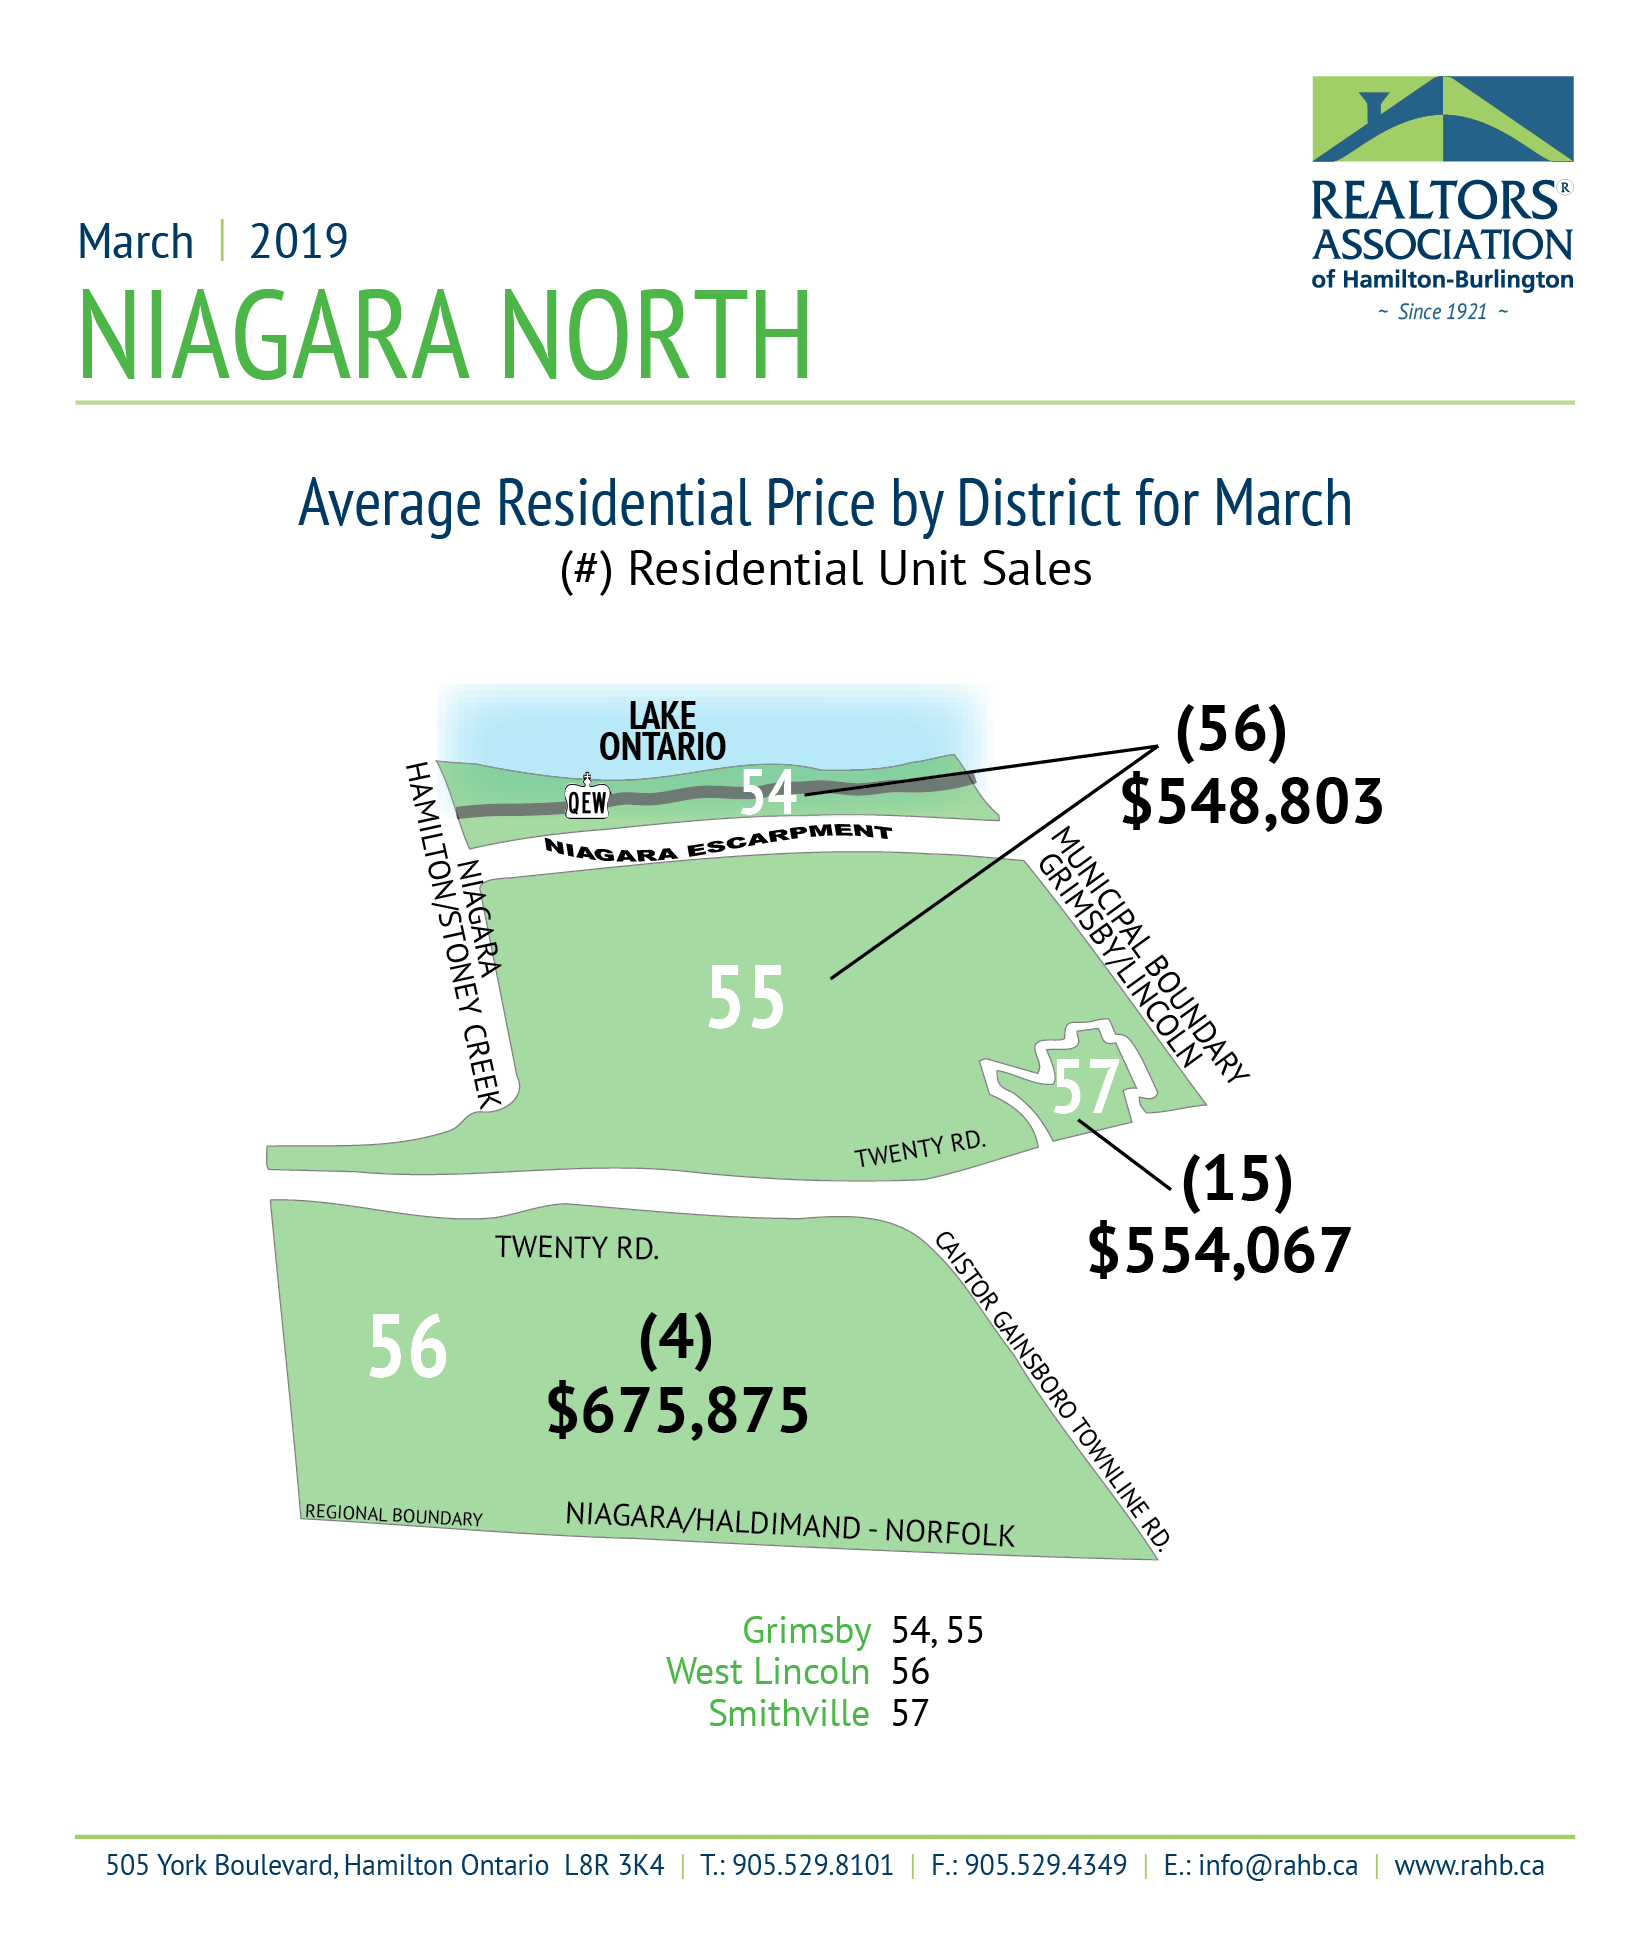
Niagara North
- Residential Real Estate Market Activity Table for Niagara North
- Niagara North Market Activity and HPI Report (31 pages)
- Niagara North Area Map