Mar 27, 2017 | MLS®, Stats & Technology |
PRESS RELEASE – For immediate release
March 3, 2017 (Hamilton, Ontario)
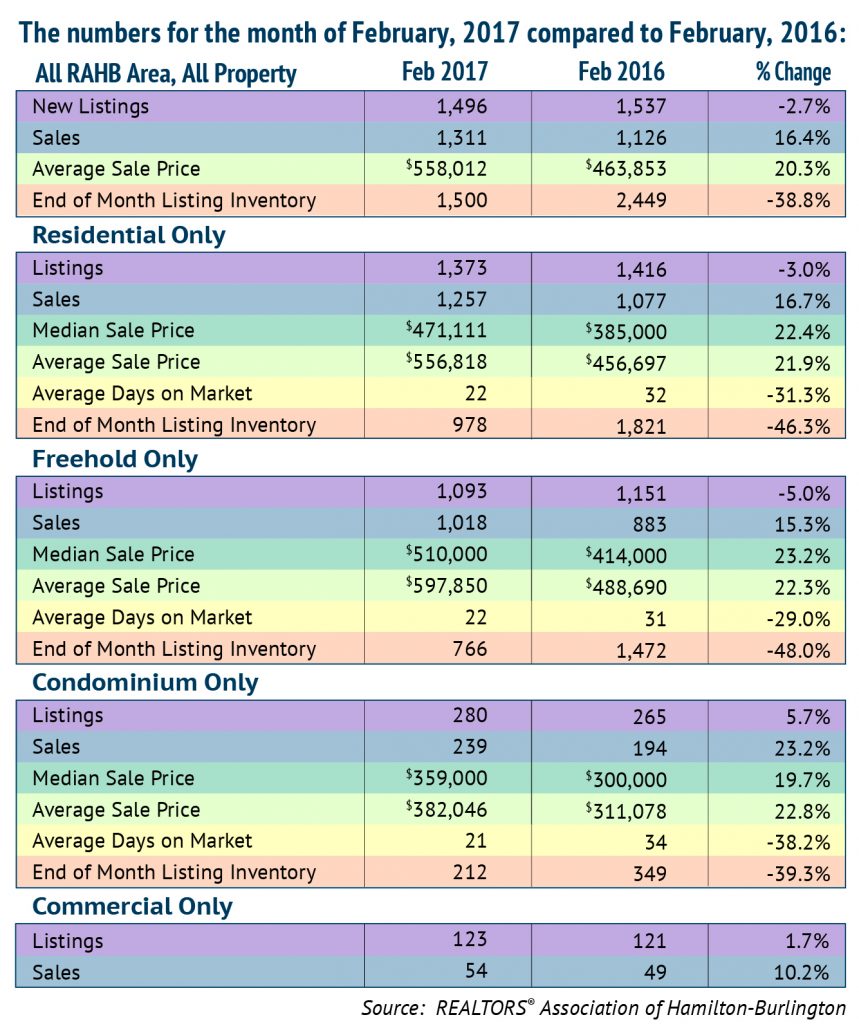
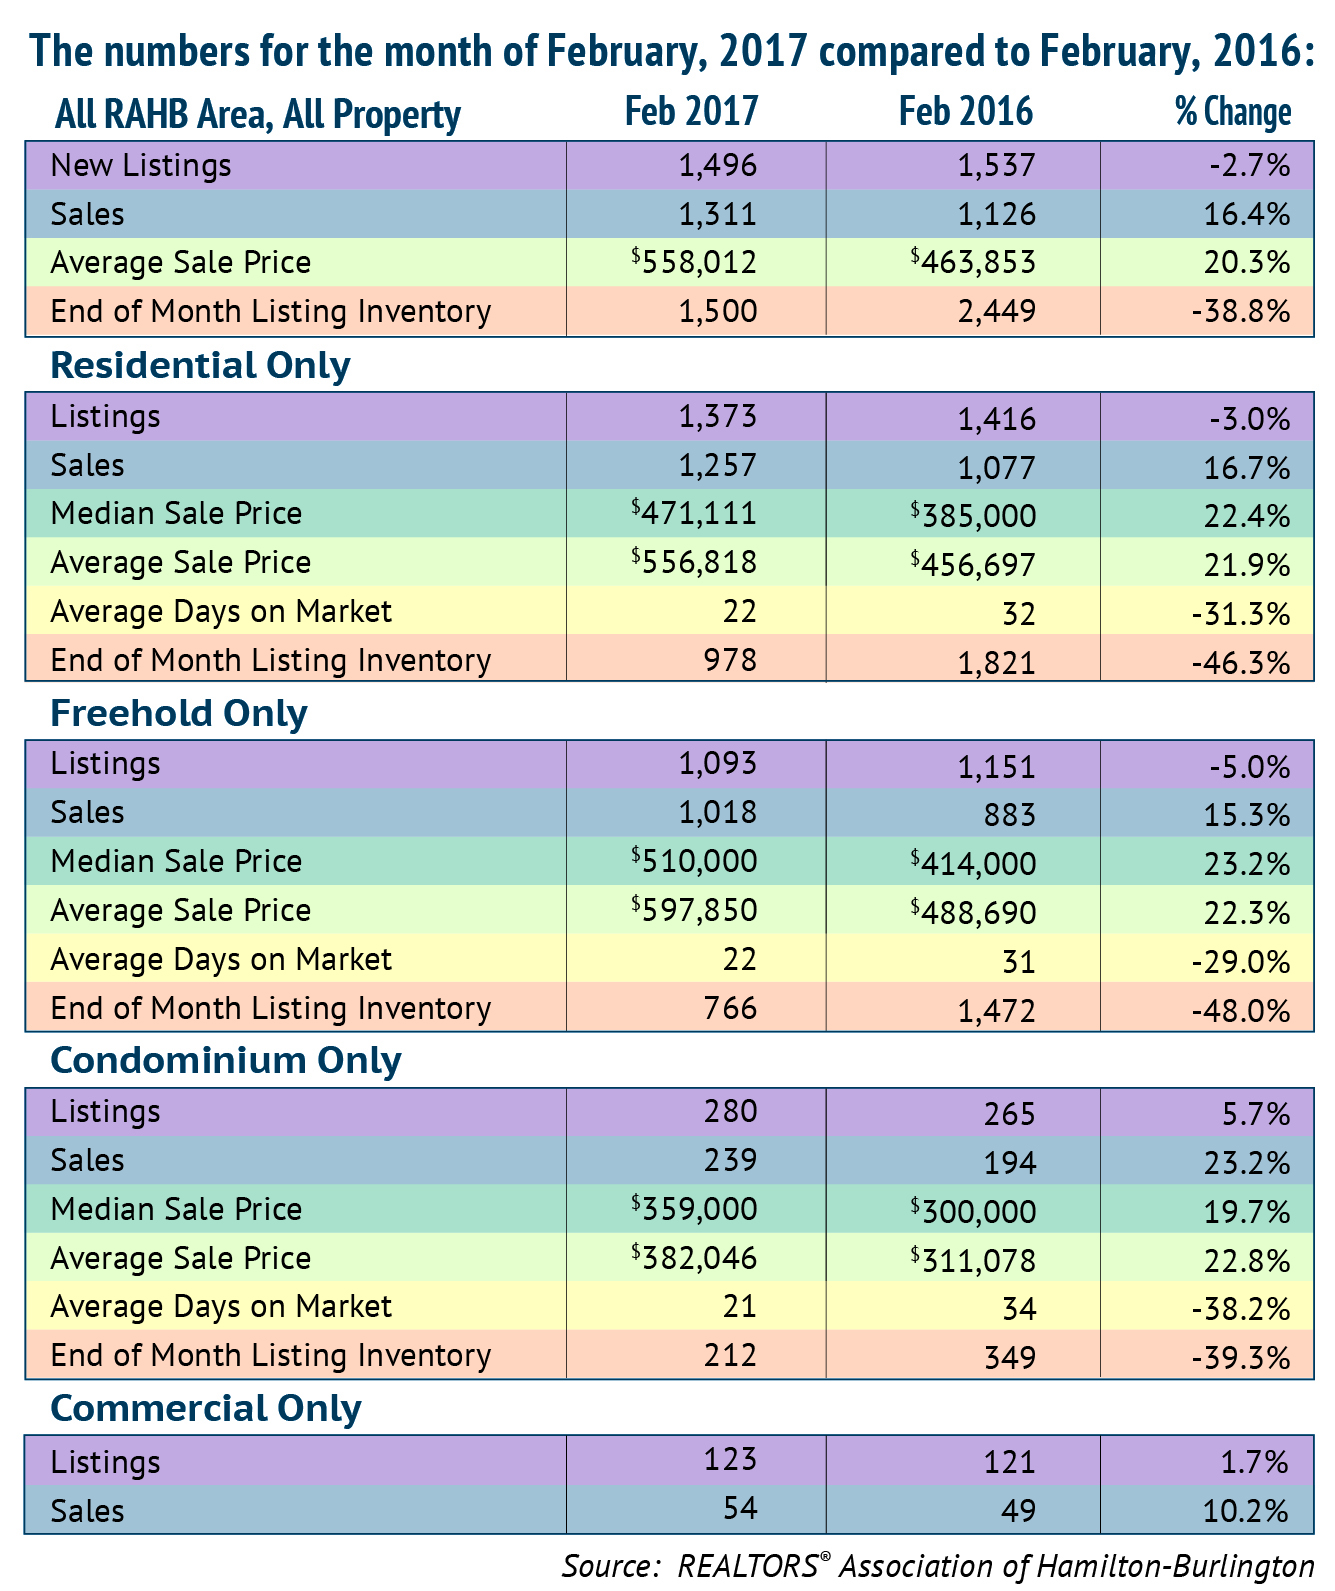
The REALTORS® Association of Hamilton-Burlington (RAHB) reported 1,311 sales were processed through the RAHB Multiple Listing Service® (MLS®) System in February. Total property sales were 16.4 per cent higher than the same month last year and, for the second month in a row, set a new high for that month.
There were 1,496 properties listed in February, a decrease of 2.7 per cent compared to February of last year and 8.4 per cent lower than the 10-year average for new listings in the month.
“February’s sales were what we’d expect to see during the spring or fall markets, typically the busier times,” said RAHB CEO George O’Neill. “With the number of available properties down and record sales, we are left with a low inventory at the end of the month. In the residential market, there is less than one month of available properties right now. We continue to be deep into a seller’s market.”
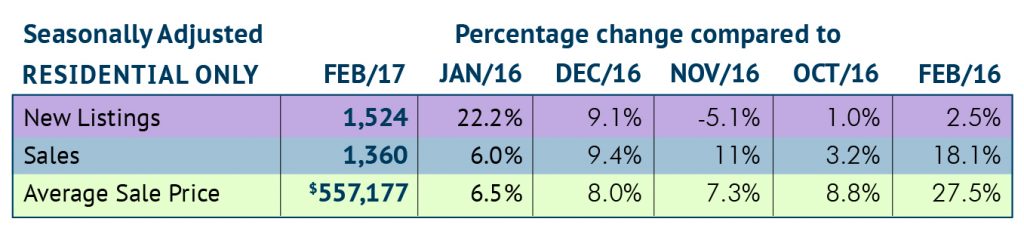
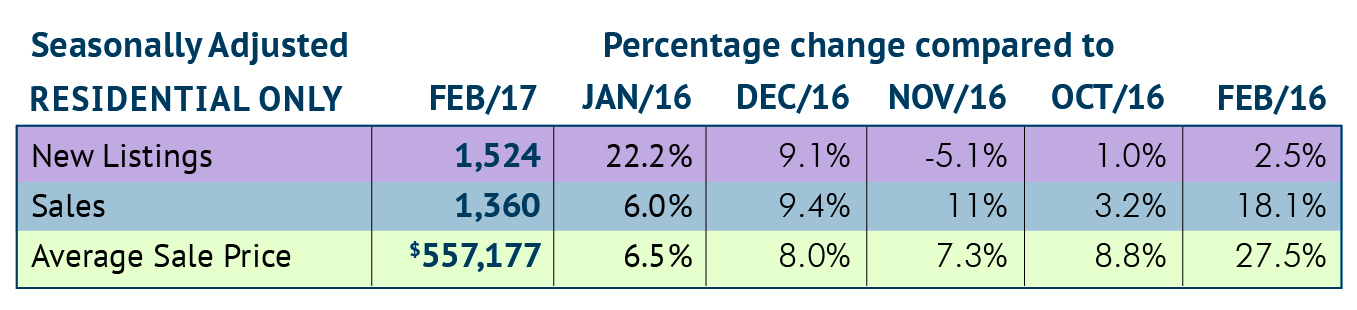
Seasonally adjusted* sales of residential properties were 18.1 per cent higher than the same month last year, with the average sale price up 27.5 per cent for the month. Seasonally adjusted numbers of new listings were 2.5 per cent higher than February of 2016.
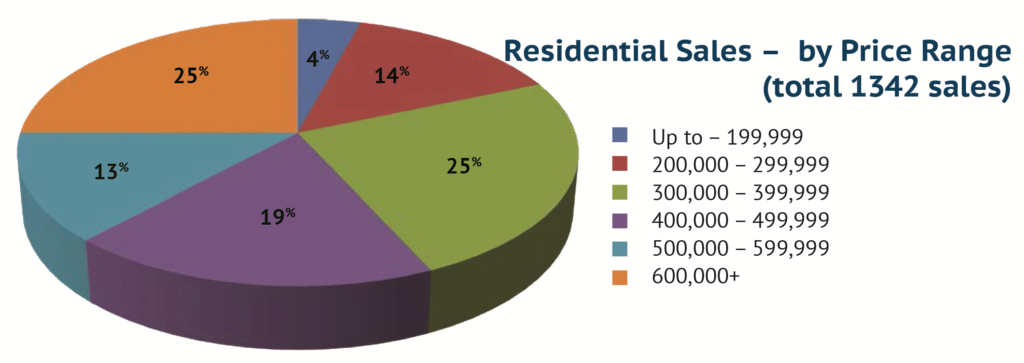
Overall residential sales of 1,257 units were 16.7 per cent higher than the same month last year. Residential freehold sales were 15.3 per cent higher than February of 2016 while sales in the condominium market were 23.2 per cent higher than the same month last year.
The median price of freehold properties increased by 23.2 per cent over the same month last year while the median price for condominium properties increased by 19.7 per cent compared to the same period.
The average price of freehold properties showed an increase of 22.3 per cent compared to February of last year; the average sale price in the condominium market increased by 22.8 per cent compared to the same period.
Average sale price is based on the total dollar volume of all properties sold through the RAHB MLS® System. Average sale price can be useful in establishing long-term trends, but should not be used as an indicator that specific properties have increased or decreased in value. Contact a REALTOR® for information about your area or property.
The average number of days on market decreased from 31 to 22 days in the freehold market and from 34 to 21 days in the condominium market, compared to February of last year.
“The first two months of 2017 have been blockbusters”, noted O’Neill. “Residential sales for 2017 are already 17.1 per cent higher than they were last year for the same period, and both median and average sale prices are up around 19 per cent. The spring market has started early.”
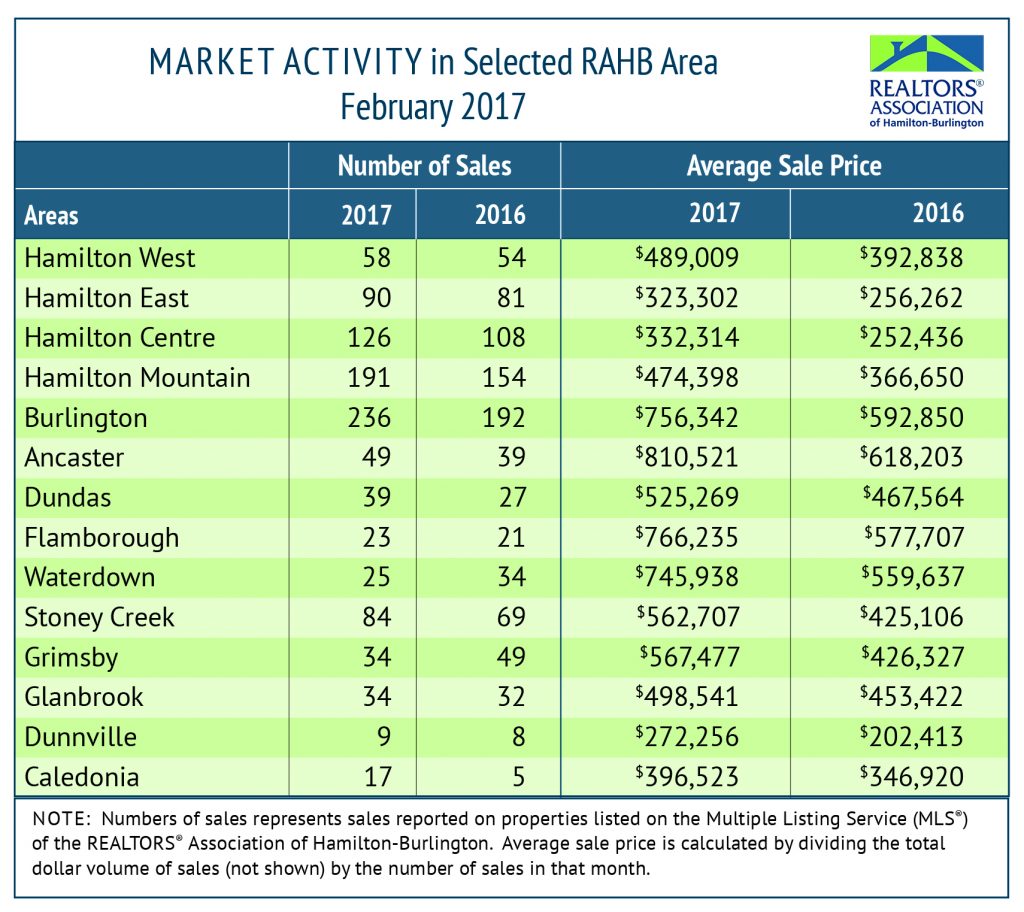
Every community in RAHB’s market area has its own localized market. Please refer to the accompanying chart, and contact a REALTOR® for more information.
*Seasonal adjustment removes normal seasonal variations, enabling analysis of monthly changes and fundamental trends in the data.
About the REALTORS® Association of Hamilton-Burlington
Established in 1921, the REALTORS® Association of Hamilton-Burlington (RAHB) represents more than 3,000 real estate brokers and sales representatives from Hamilton, Burlington and outlying areas. Members of the Association may use the REALTOR® trademark, which identifies them as real estate professionals who subscribe to a strict code of ethics. The Association operates the local Multiple Listing Service® (MLS®) System and provides ongoing professional education courses for its members. Advertisements of local MLS® property listings and information about the services provided by a REALTOR® can be found at REALTOR.ca. More information about RAHB is available at rahb.ca.
Feb 6, 2017 | MLS®, Stats & Technology |
February 3, 2017 (Hamilton, Ontario)
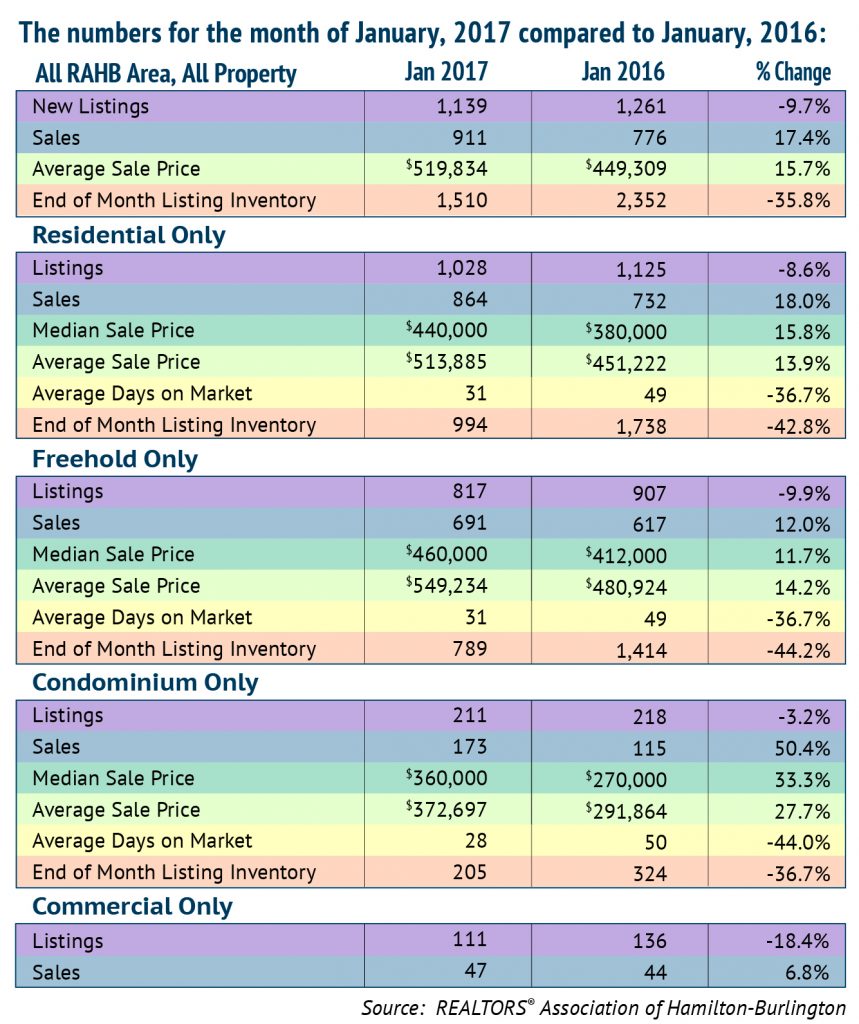
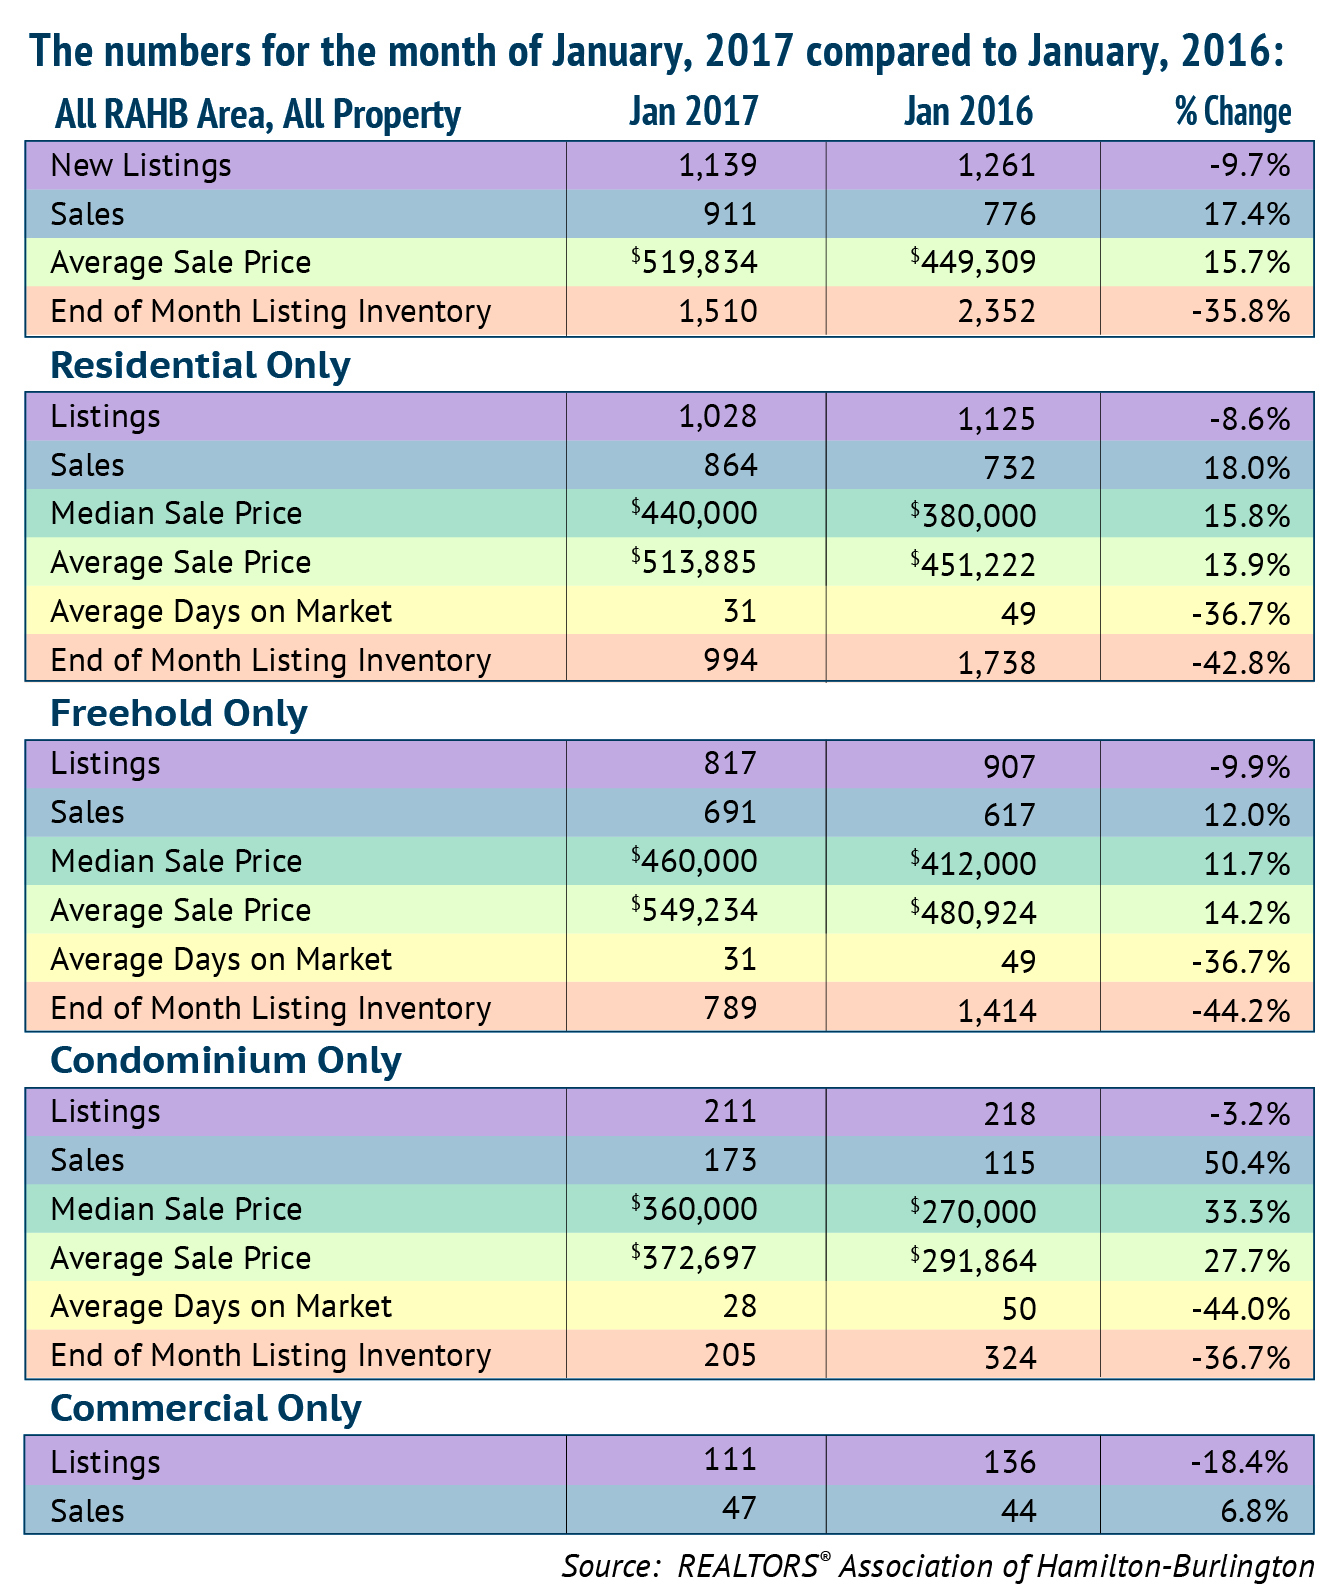
The REALTORS® Association of Hamilton-Burlington (RAHB) reported 911 sales were processed through the RAHB Multiple Listing Service® (MLS®) System in January. All property sales were 17.4 per cent higher than the same month last year and set a new high for the month of January.
There were 1,139 properties listed in January, a decrease of 9.7 per cent compared to January of last year and 30 per cent less than the 10-year average for new listings in the month.
“January’s record sales topped the previous high from 2006 by more than 11 per cent,” said RAHB CEO George O’Neill. “That’s quite remarkable for a January, when sales are typically slower. At the same time as we had such high sales, new listings are down for the month, compared to both last year and the 10-year average.”
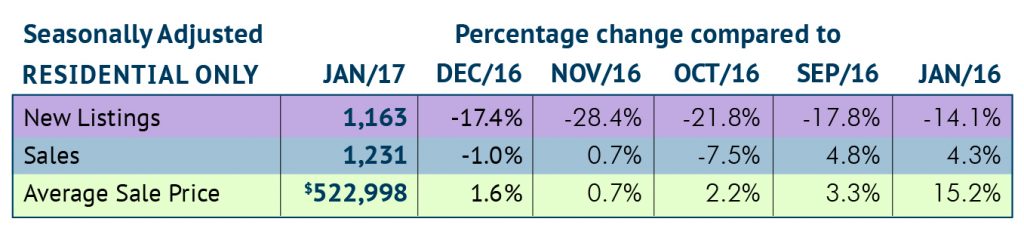
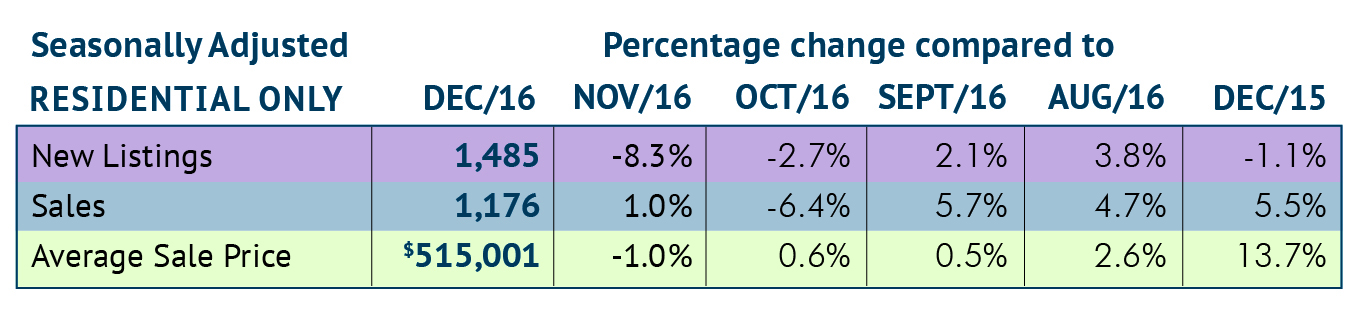
Seasonally adjusted* sales of residential properties were 4.3% per cent higher than the same month last year, with the average sale price up 15.2 per cent for the month. Seasonally adjusted numbers of new listings were 14.1 per cent lower than January of 2016.
Overall residential sales of 864 units were 18 per cent higher than the same month last year. Residential freehold sales were 12 per cent higher than January of 2016 while sales in the condominium market were 50.5 per cent higher than the same month last year.
The median price of freehold properties increased by 11.7 per cent over the same month last year while the median price for condominium properties increased by 33.3 per cent compared to the same period.
The average price of freehold properties showed an increase of 14.2 per cent compared to January of last year; the average sale price in the condominium market increased by 27.7 per cent compared to the same period.
Average sale price is based on the total dollar volume of all properties sold through the RAHB MLS® System. Average sale price can be useful in establishing long-term trends, but should not be used as an indicator that specific properties have increased or decreased in value. Contact a REALTOR® for information about your area or property.
The average number of days on market decreased from 49 to 31 days in the freehold market and from 50 to 28 days in the condominium market, compared to January of last year.
“With the sales-to-listing ratio at 83 per cent in the residential market, the average days on market down to 31 days at this time of year and only a little over a month of residential listing inventory, this hot seller’s market just keeps rolling on,” added O’Neill. “We keep stressing the importance of using a REALTOR® at any time, but now, in this market, it’s especially important to use a professional who can help buyers and sellers achieve the best results in the purchase or sale of their home. A reduced average number of days on the market does not necessarily mean it is easier to sell properties.”
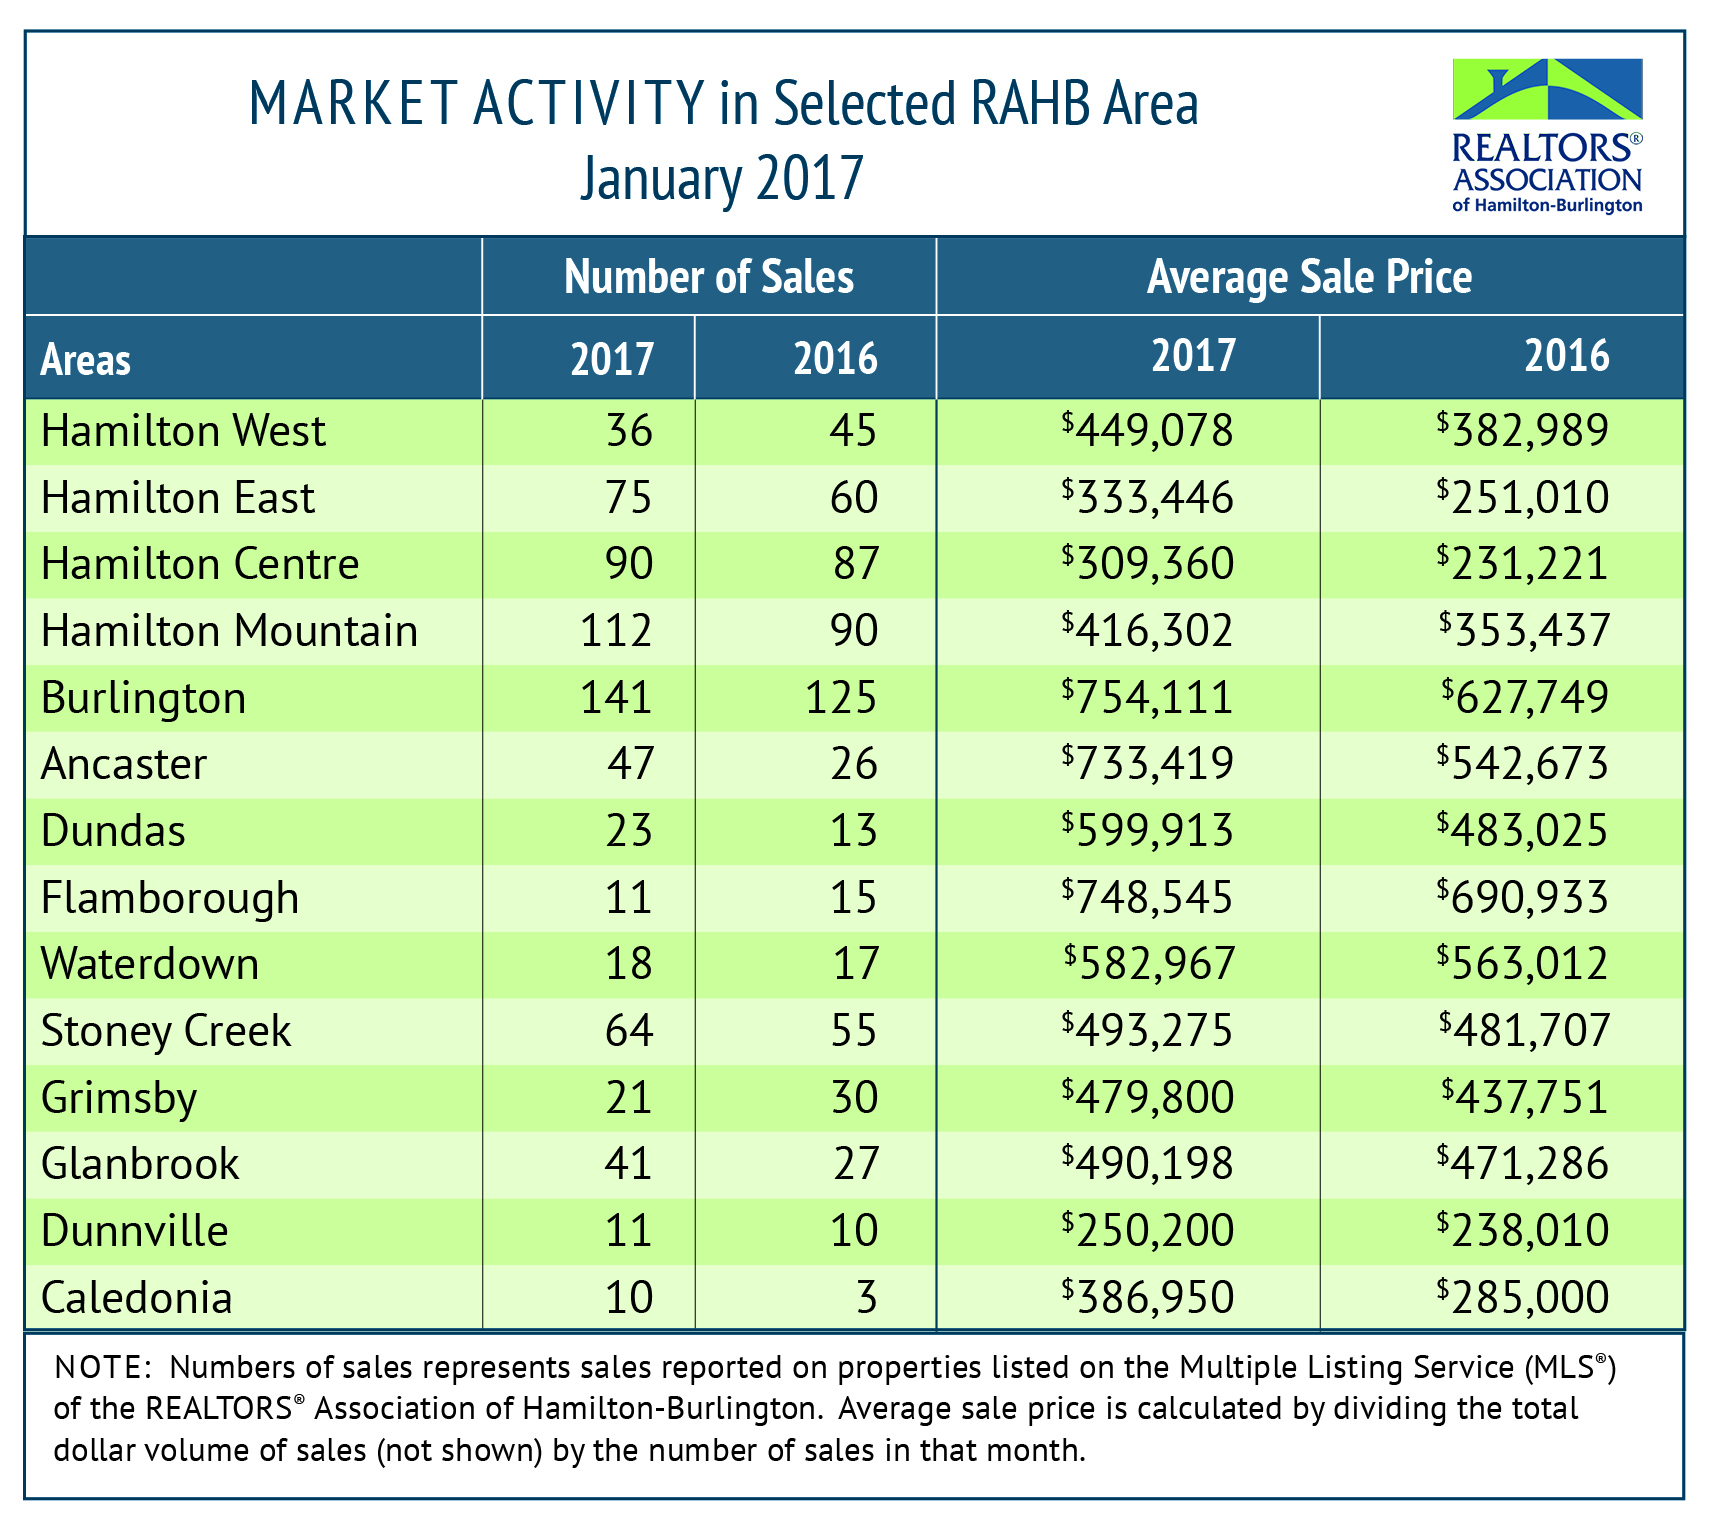
 Every community in RAHB’s market area has its own localized market. Please refer to the accompanying chart, and contact a REALTOR® for more information.

*Seasonal adjustment removes normal seasonal variations, enabling analysis of monthly changes and fundamental trends in the data.
_______________________________________________________________________________________________
About the REALTORS® Association of Hamilton-Burlington
Established in 1921, the REALTORS® Association of Hamilton-Burlington (RAHB) represents more than 3,000 real estate brokers and sales representatives from Hamilton, Burlington and outlying areas. Members of the Association may use the REALTOR® trademark, which identifies them as real estate professionals who subscribe to a strict code of ethics. The Association operates the local Multiple Listing Service® (MLS®) System and provides ongoing professional education courses for its members. Advertisements of local MLS® property listings and information about the services provided by a REALTOR® can be found at REALTOR.ca. More information about RAHB is available at rahb.ca.
Feb 6, 2017 | MLS®, Stats & Technology |
Feb 3, 2017 | MLS®, Stats & Technology |
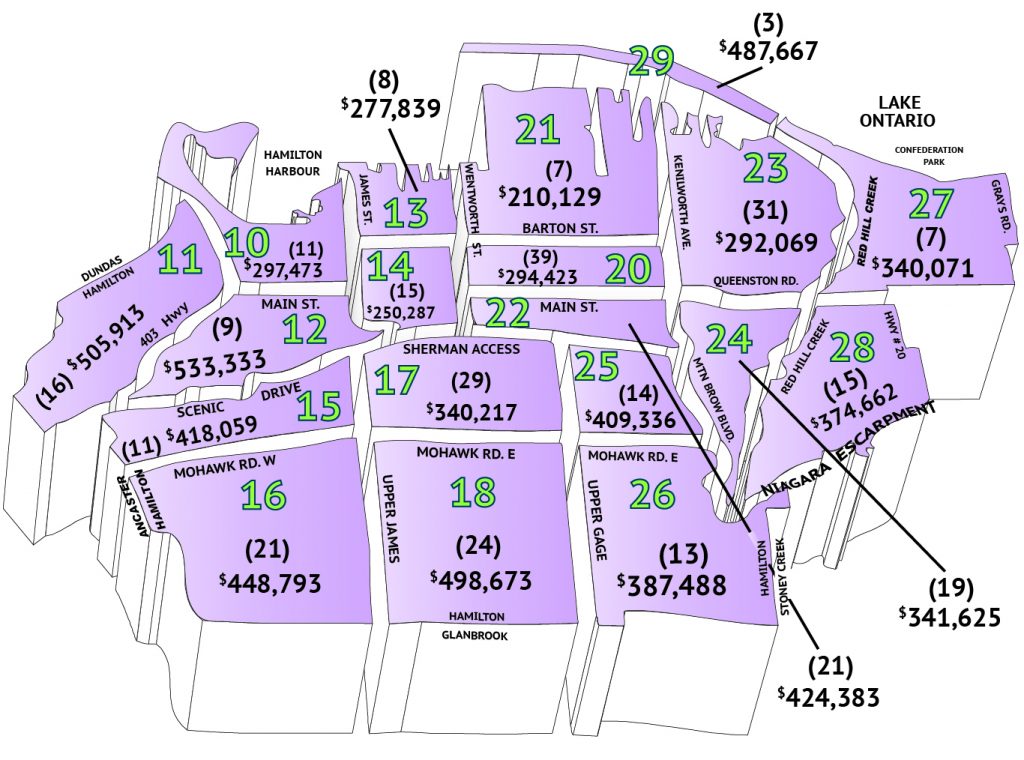
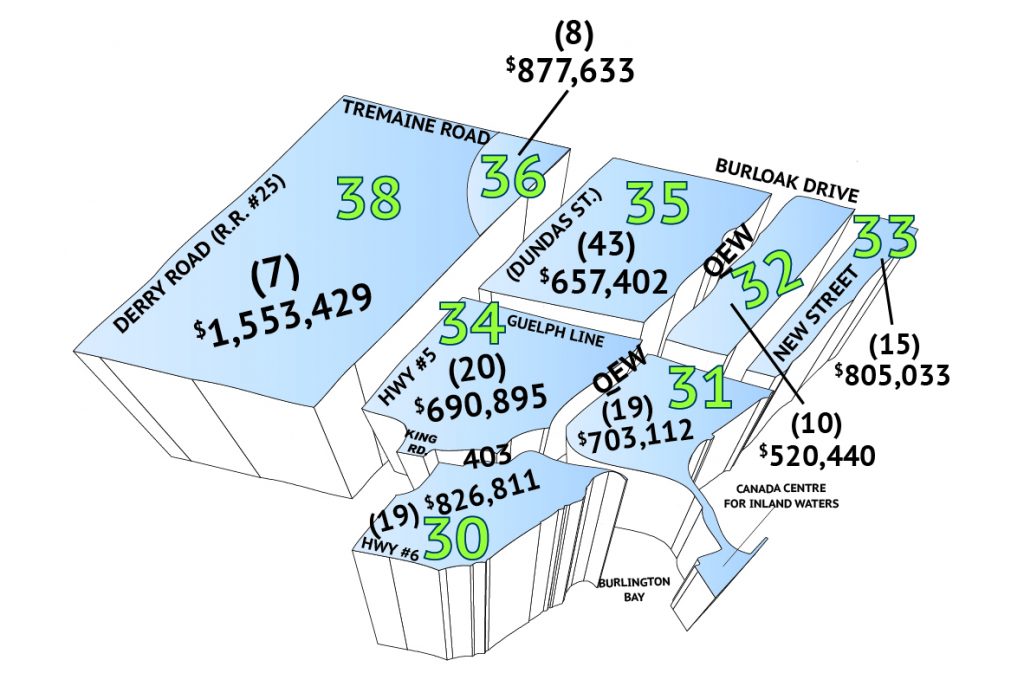
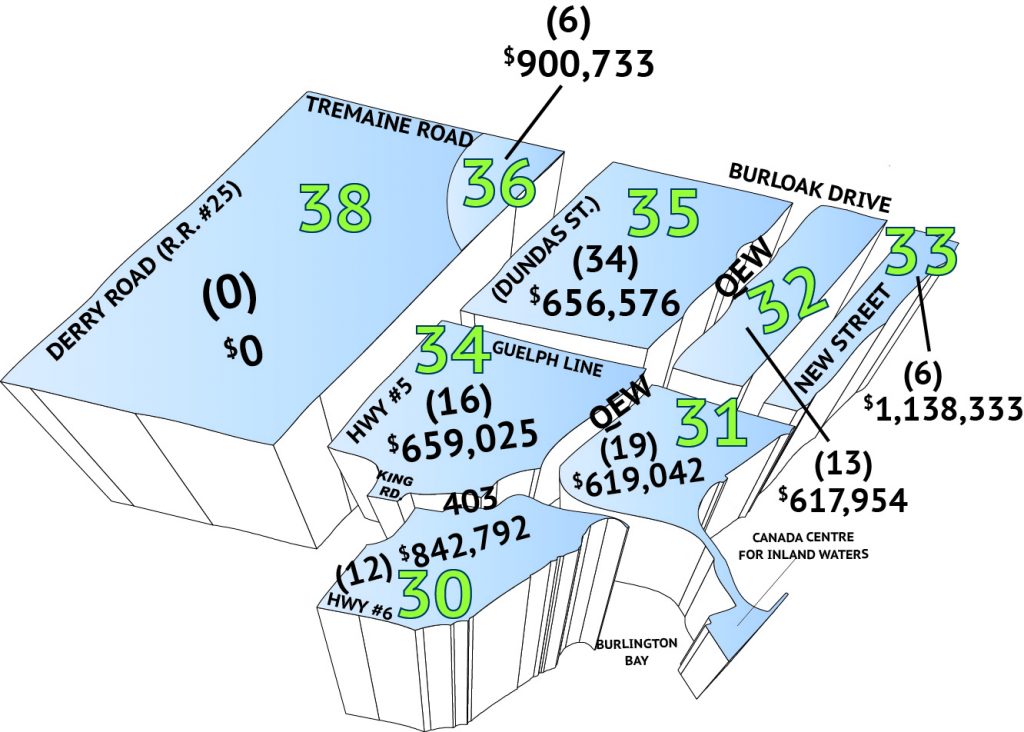
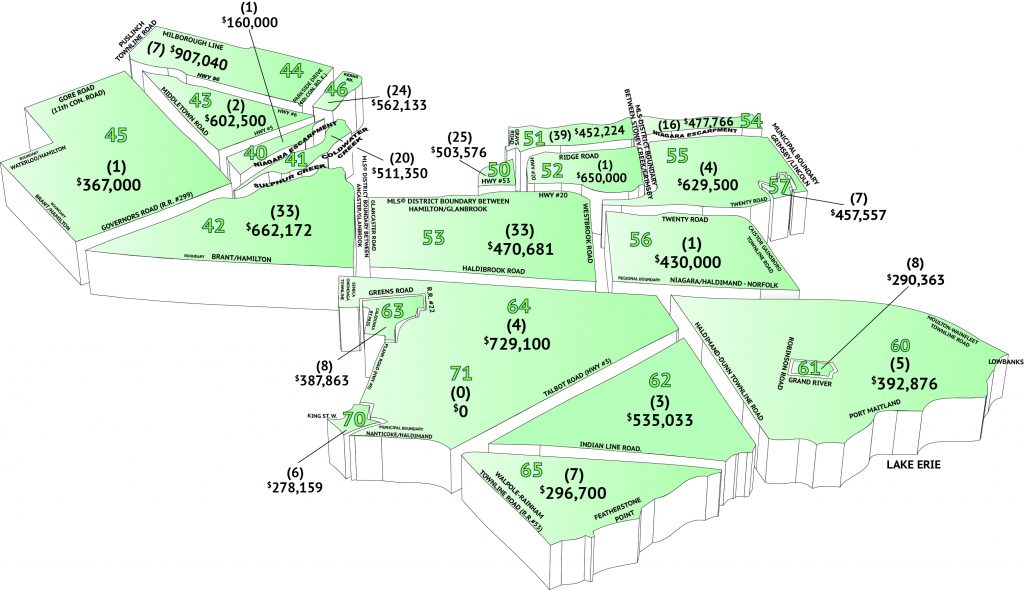
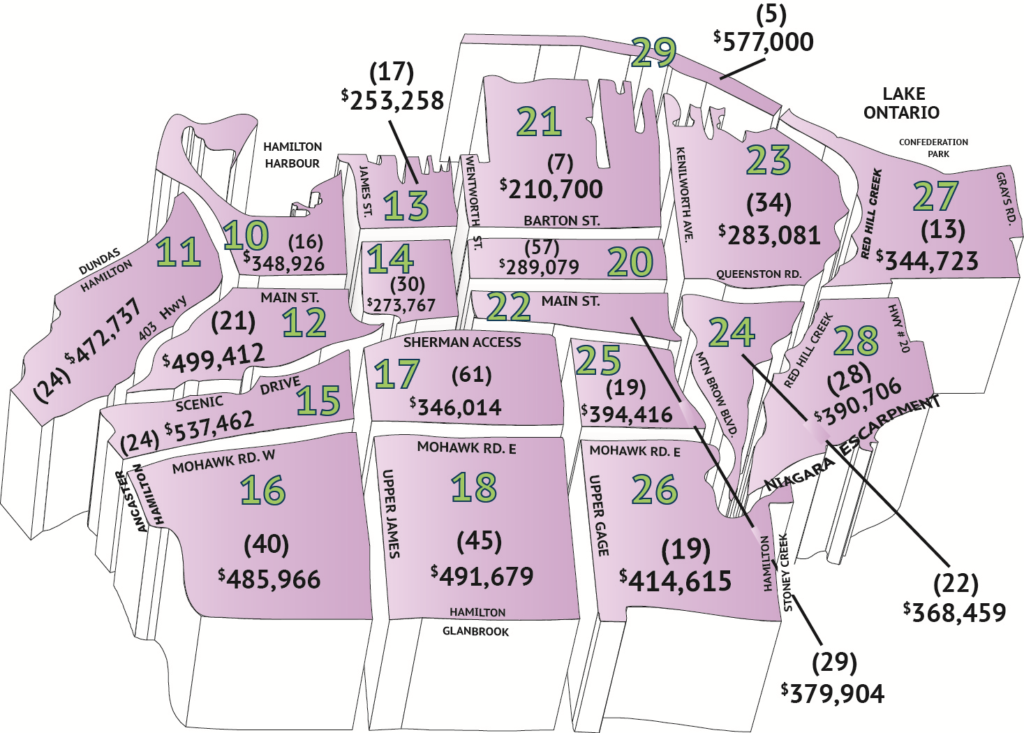
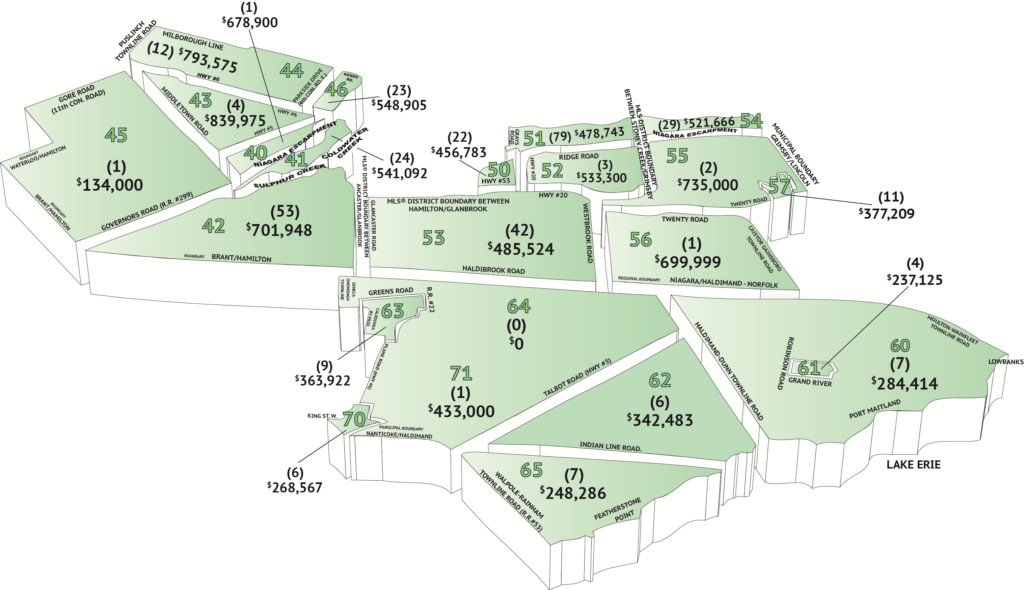
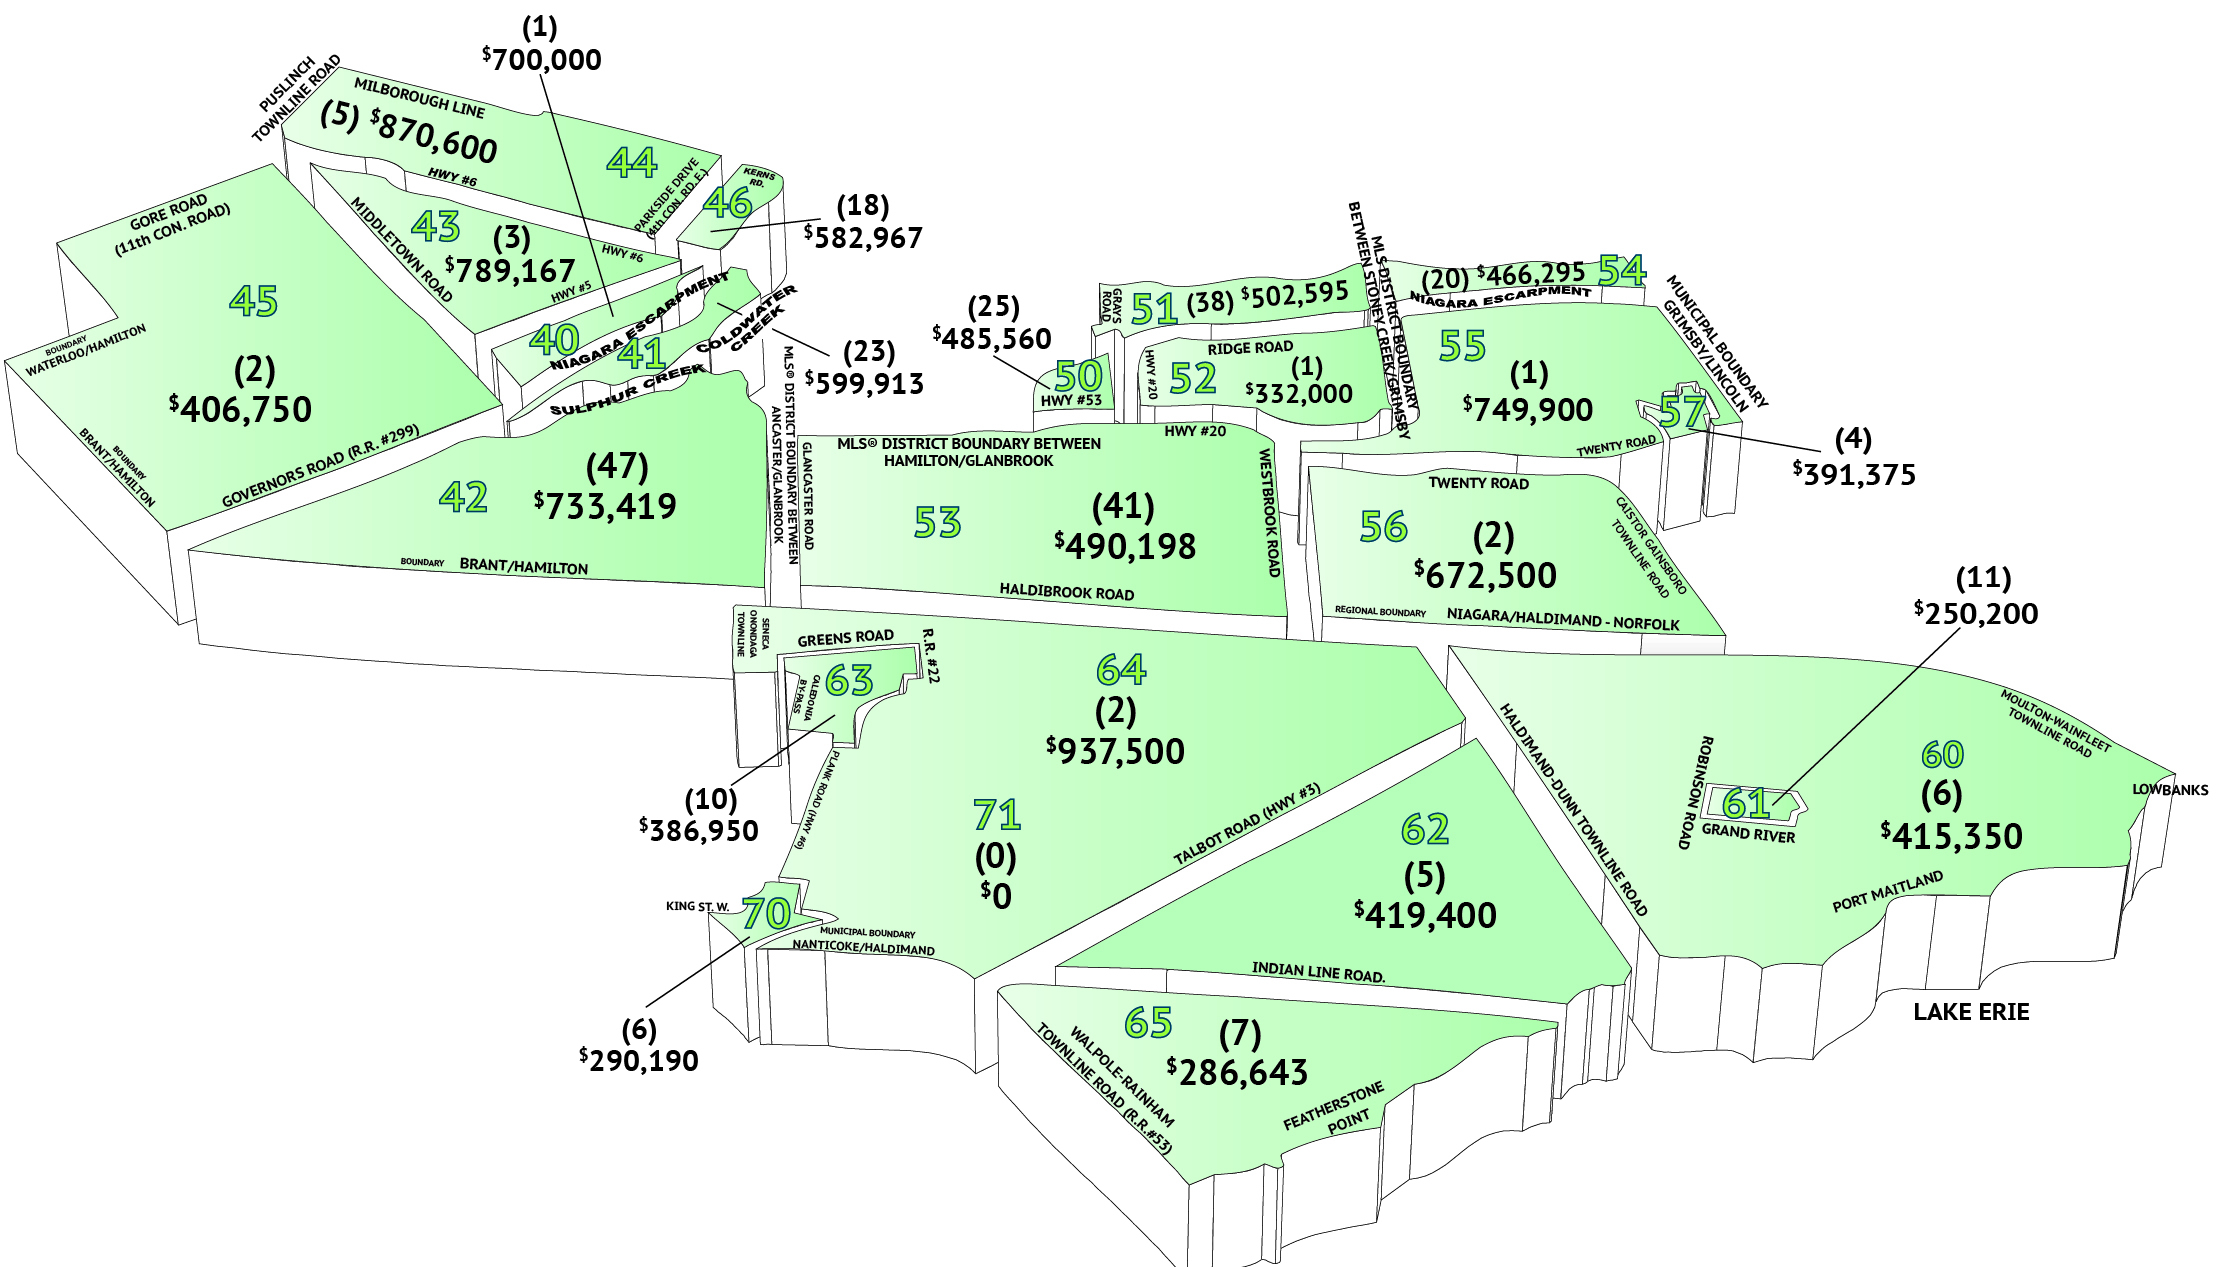
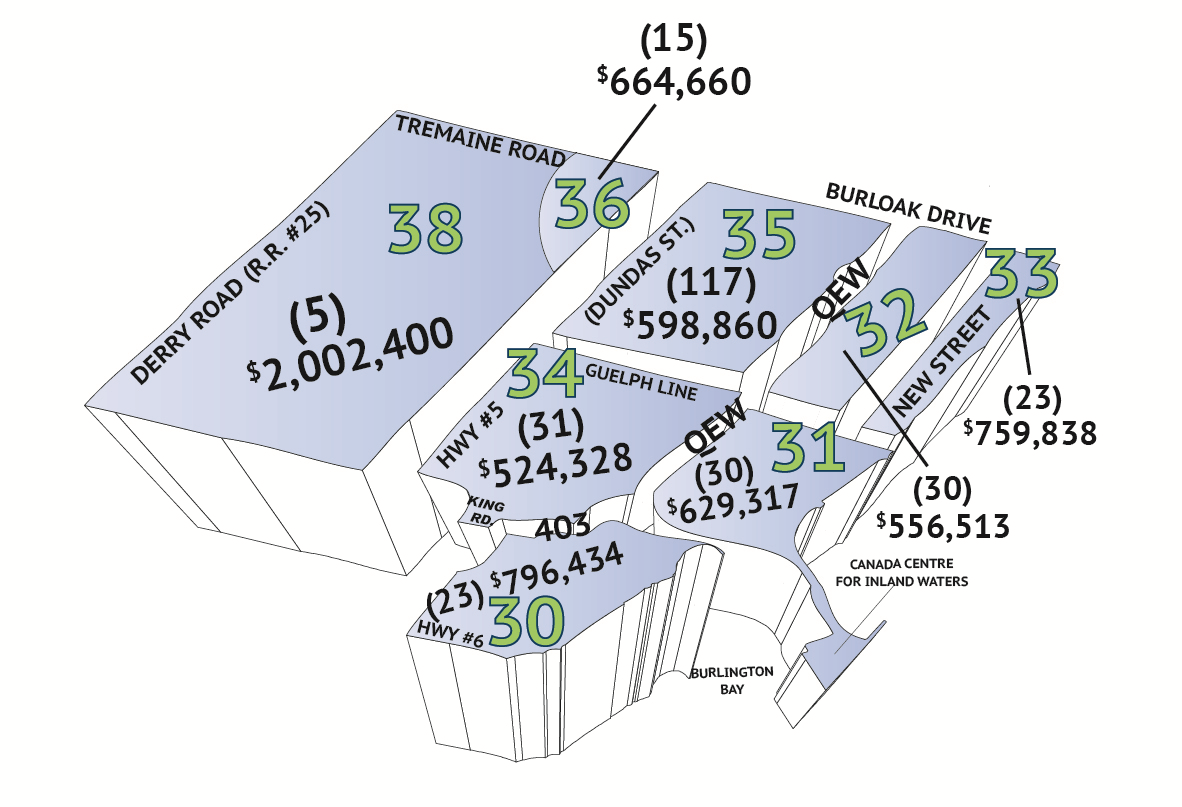
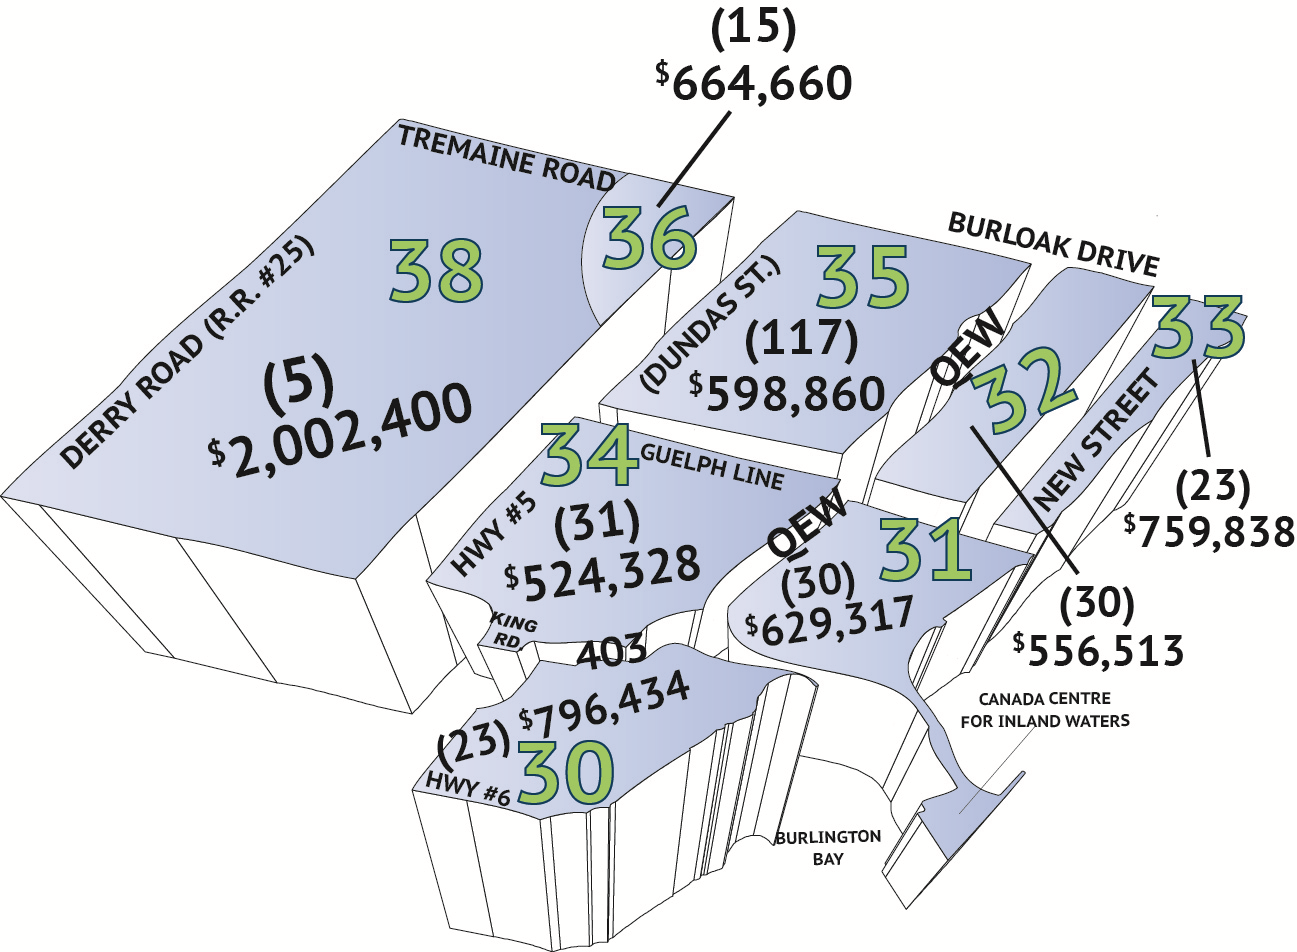
RAHB Average Price by District – (#) Residential Unit Sales
Hamilton
Hamilton West, 10 – 12
Hamilton East, 23, 24, 27 – 29
Hamilton Centre, 13, 14, 20 – 22
Hamilton Mountain, 15 – 18, 25 & 26
Burlington 30 – 36, 38
Outlying
Flamborough, 40, 43 – 45
Dundas, 41
Ancaster, 42
Waterdown, 46
Stoney Creek, 50 – 52
Glanbrook, 53
Grimsby, 54 -55
West Lincoln, 56
Smithville, 57
Dunnville, 61
Cayuga, 62
Calendonia/Hagersville, 63 & 70
Onieda/Seneca, 71 & 64
Rainham, 65
Canborough/Dunn, 60

Jan 12, 2017 | MLS®, Stats & Technology |
PRESS RELEASE – For immediate release
January 5, 2017 (Hamilton, Ontario)
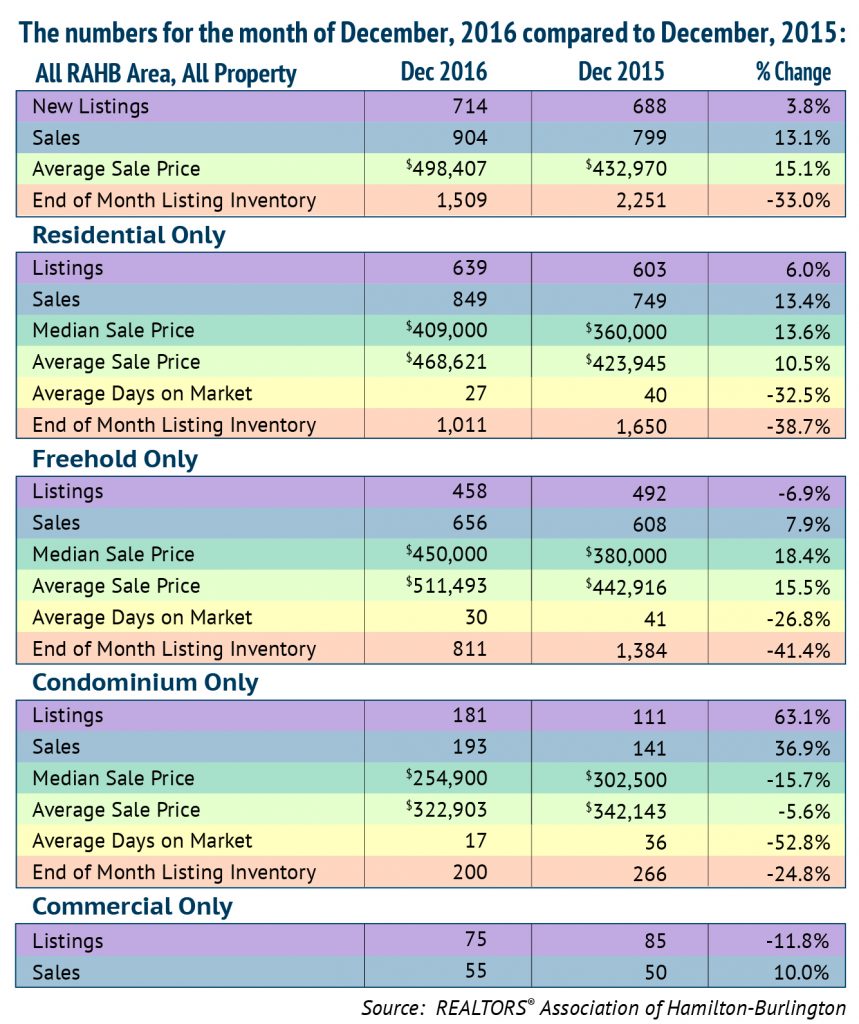
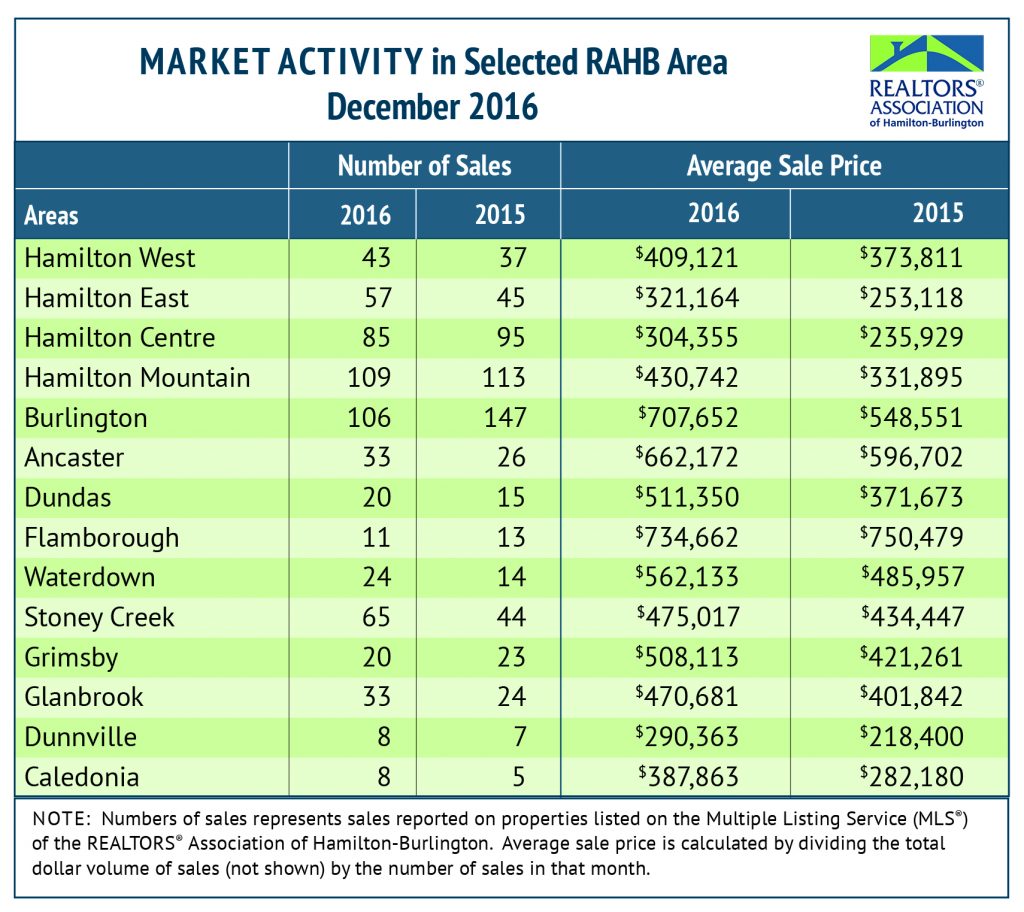
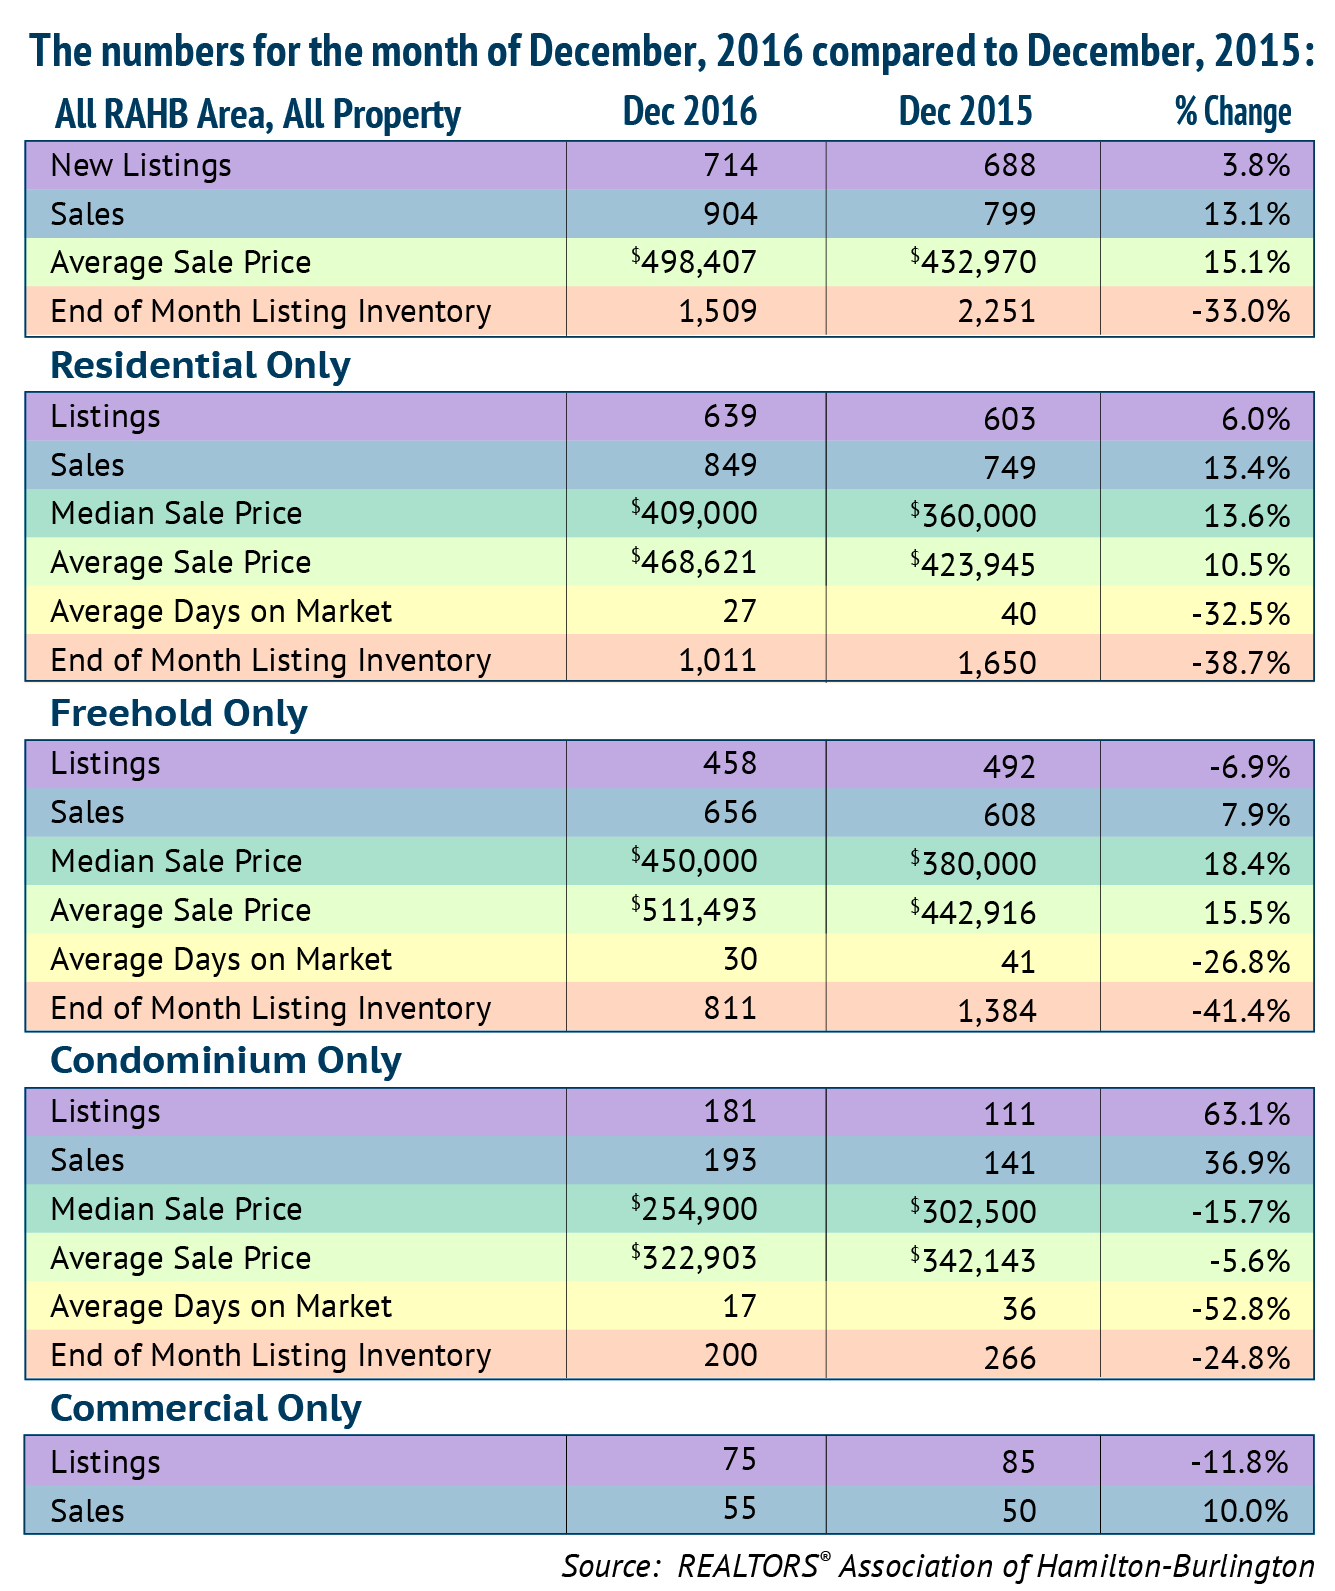
The REALTORS® Association of Hamilton-Burlington (RAHB) reported 904 sales were processed through the RAHB Multiple Listing Service® (MLS®) System in December. Sales were 13.1 per cent higher than the same month last year and set a new high for the month of December. This was the sixth month in 2016 to see a new monthly sales record.
There were 714 properties listed in December, an increase of 3.8 per cent compared to December of last year and right on the 10-year average for new listings in the month.
“Consumers were shopping for more than Boxing Day sales this year,” said RAHB CEO George O’Neill. “December sales broke the record for December set only last year. The record sales for the month coupled with an average number of new listings means we are going into the new year with low inventory.”
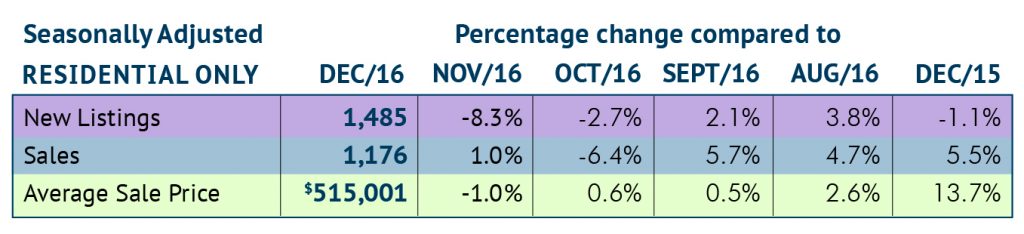
Seasonally adjusted* sales of residential properties were 5.5 per cent higher than the same month last year, with the average sale price up 13.7per cent for the month. Seasonally adjusted numbers of new listings were 1.1 per cent lower than December of 2015.
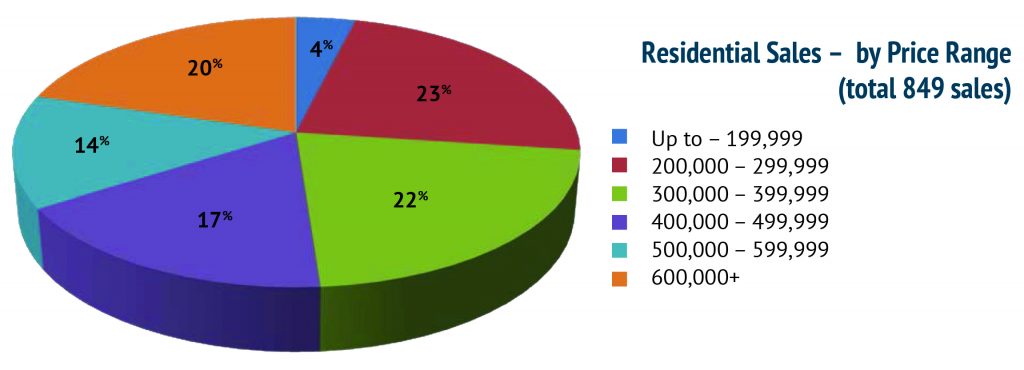
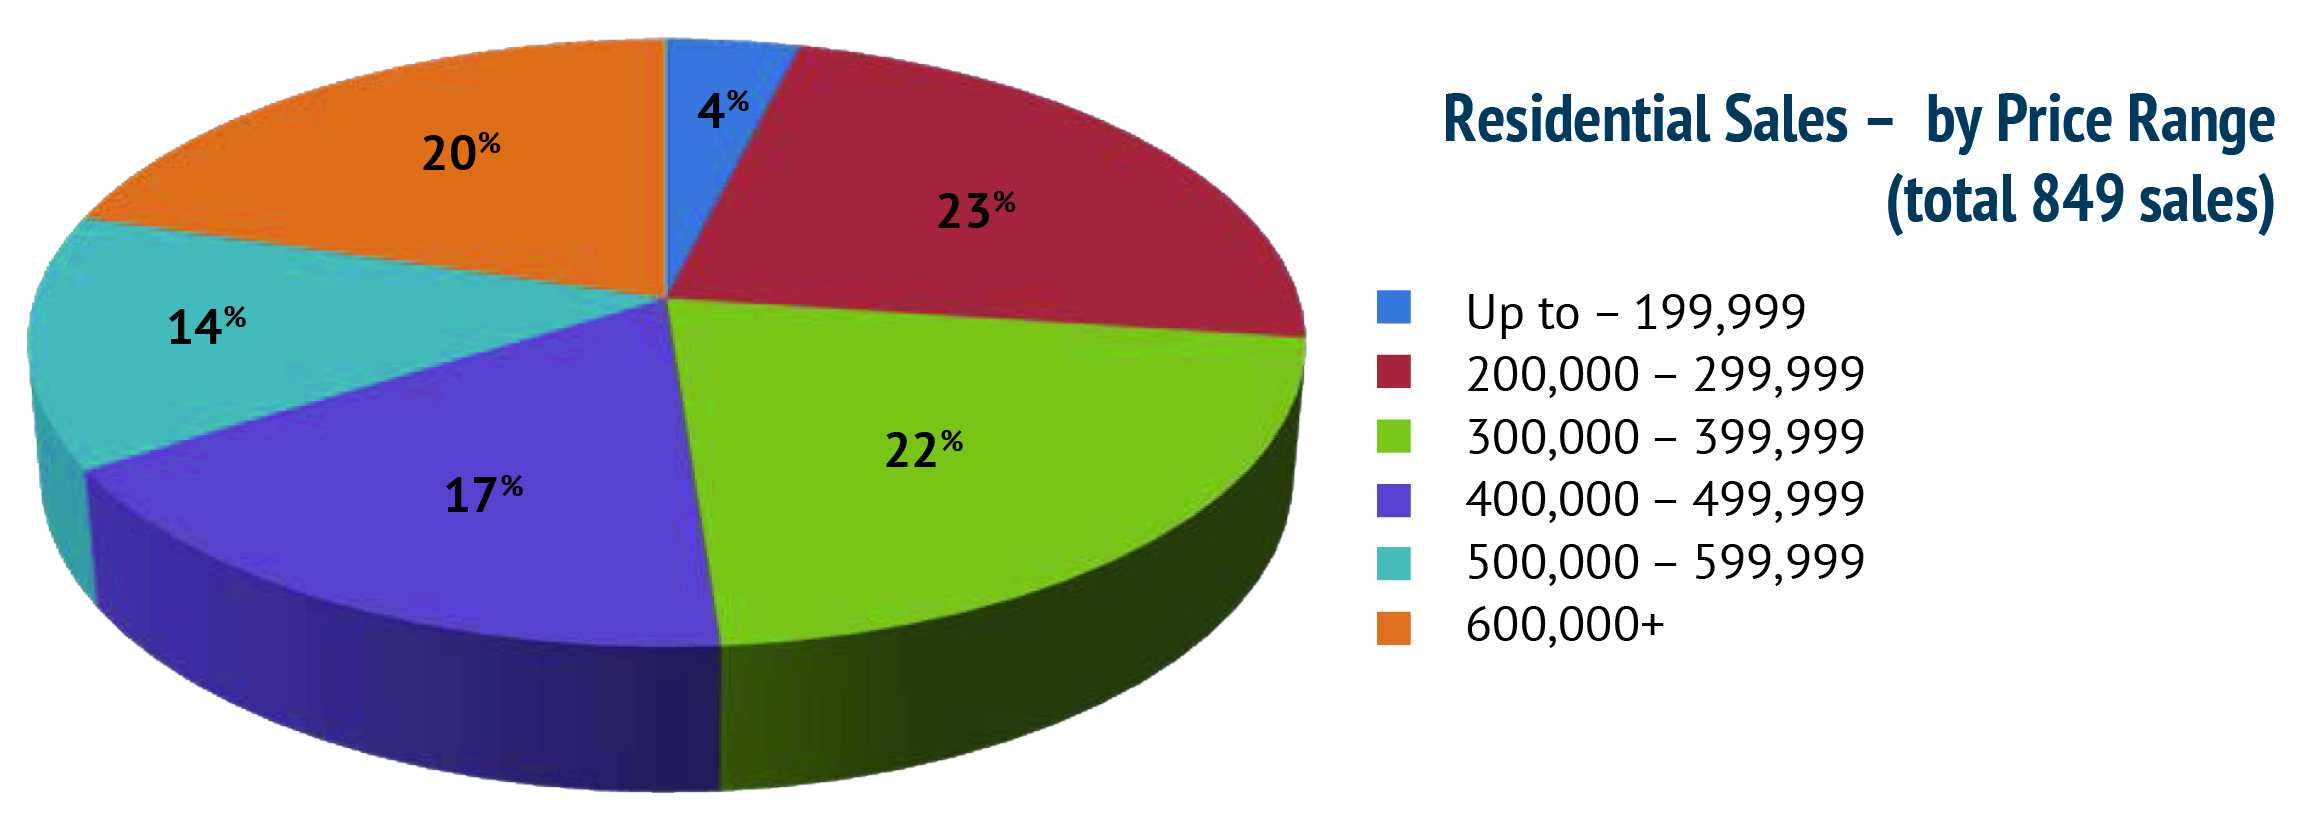
Overall residential sales of 849 units were 13.4 per cent higher than the same month last year. Residential freehold sales were 7.9 per cent higher than December of 2015 while sales in the condominium market were 36.9 per cent higher than the same month last year.
The median price of freehold properties increased by 18.4 per cent over the same month last year while the median price for condominium properties decreased by 15.7 per cent compared to the same period.
The average price of freehold properties showed an increase of 15.5 per cent compared to December of last year; the average sale price in the condominium market decreased by 5.6 per cent when compared to the same period.
Average sale price is based on the total dollar volume of all properties sold through the RAHB MLS® System. Average sale price can be useful in establishing long-term trends, but should not be used as an indicator that specific properties have increased or decreased in value. Contact a REALTOR® for information about your area or property.
The average number of days on market decreased from 41 to 30 days in the freehold market and from 36 to 17 days in the condominium market, compared to December of last year.
“Clearly, home buyers – whether they are local or from outside our market area – are finding the Greater Hamilton-Burlington area an excellent place to invest their home-buying dollars,” added O’Neill.
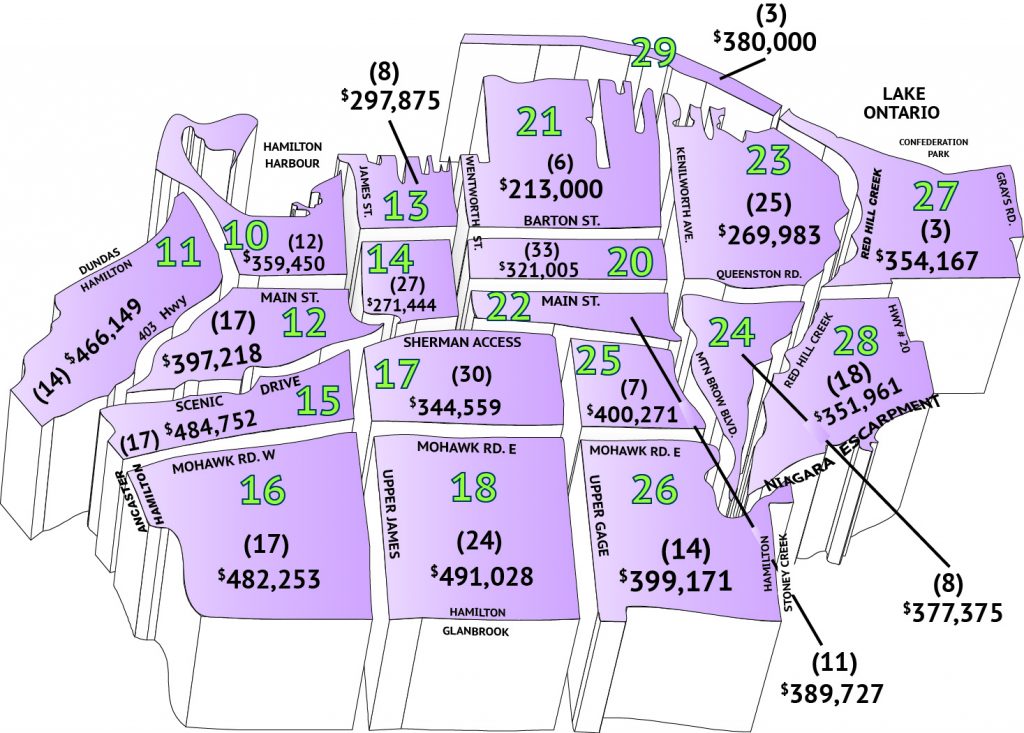
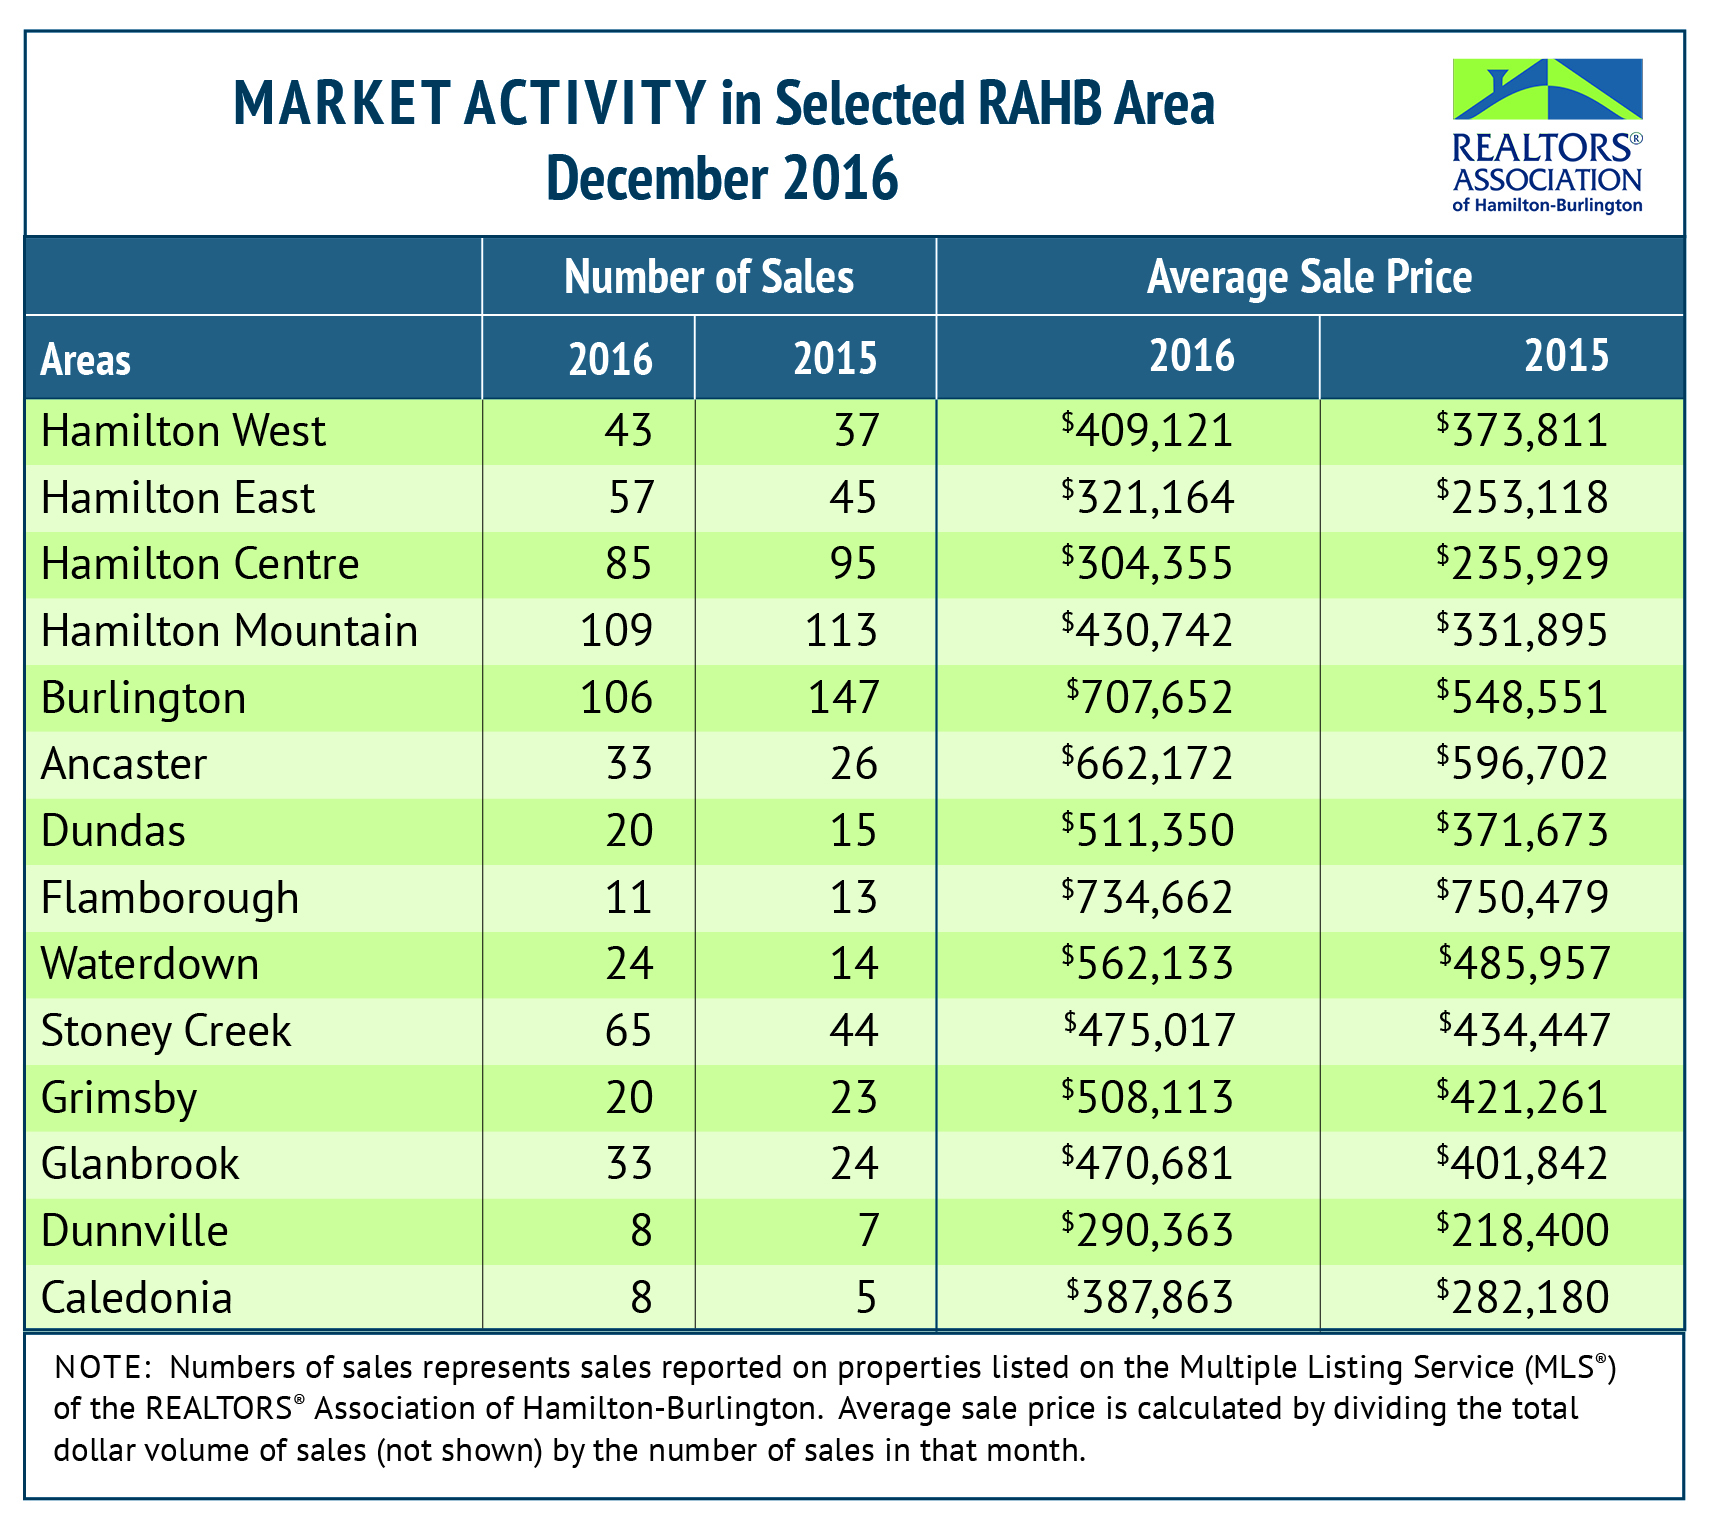
Every community in RAHB’s market area has its own localized market. Please refer to the accompanying chart, and contact a REALTOR® for more information.
*Seasonal adjustment removes normal seasonal variations, enabling analysis of monthly changes and fundamental trends in the data.
_______________________________________________________________________________________________
About the REALTORS® Association of Hamilton-Burlington
Established in 1921, the REALTORS® Association of Hamilton-Burlington (RAHB) represents more than 3,000 real estate brokers and sales representatives from Hamilton, Burlington and outlying areas. Members of the Association may use the REALTOR® trademark, which identifies them as real estate professionals who subscribe to a strict code of ethics. The Association operates the local Multiple Listing Service® (MLS®) System and provides ongoing professional education courses for its members. Advertisements of local MLS® property listings and information about the services provided by a REALTOR® can be found at REALTOR.ca. More information about RAHB is available at rahb.ca.
Jan 12, 2017 | MLS®, Stats & Technology |

Jan 12, 2017 | MLS®, Stats & Technology |
RAHB Average Price by District – (#) Residential Unit Sales
Hamilton
Hamilton West, 10 – 12
Hamilton East, 23, 24, 27 – 29
Hamilton Centre, 13, 14, 20 – 22
Hamilton Mountain, 15 – 18, 25 & 26
Burlington 30 – 36, 38
Outlying
Flamborough, 40, 43 – 45
Dundas, 41
Ancaster, 42
Waterdown, 46
Stoney Creek, 50 – 52
Glanbrook, 53
Grimsby, 54 -55
West Lincoln, 56
Smithville, 57
Dunnville, 61
Cayuga, 62
Calendonia/Hagersville, 63 & 70
Onieda/Seneca, 71 & 64
Rainham, 65
Canborough/Dunn, 60
Dec 7, 2016 | MLS®, Stats & Technology |
PRESS RELEASE – For immediate release
December 6, 2016 (Hamilton, Ontario)
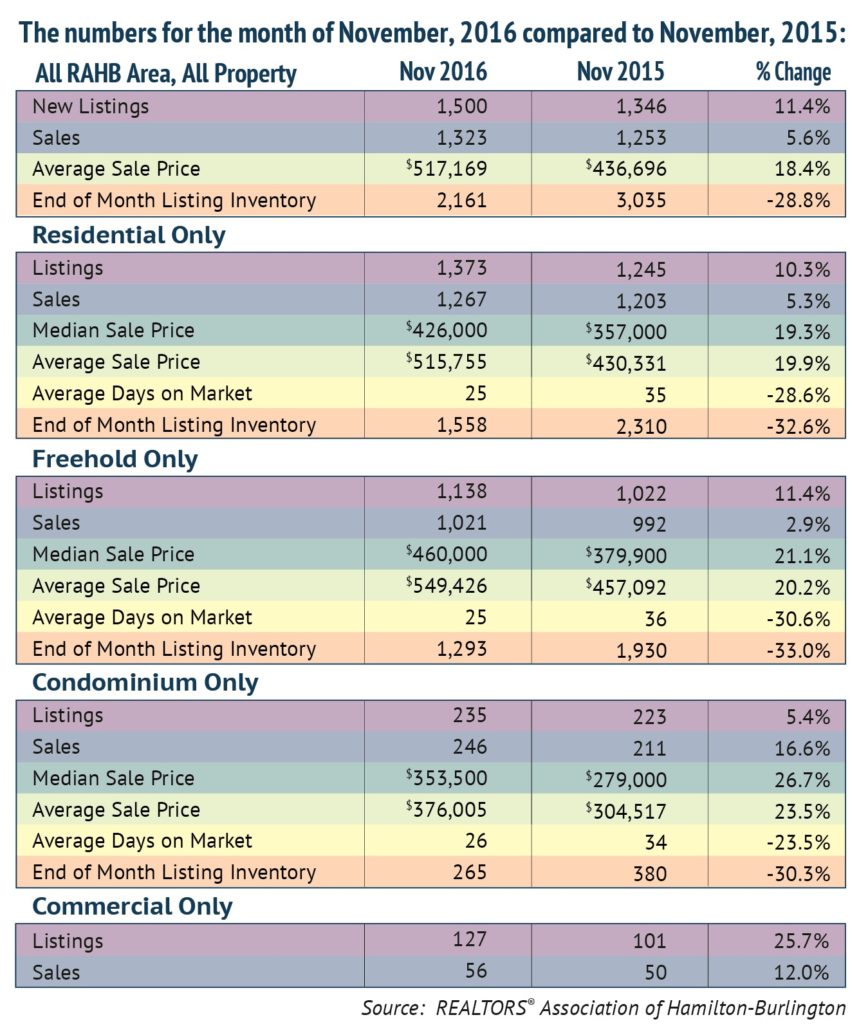
The REALTORS® Association of Hamilton-Burlington (RAHB) reported 1,323 sales were processed through the RAHB Multiple Listing Service® (MLS®) System in November. Sales were 5.6 per cent higher than the same month last year – which had the record for November sales – and set a new high for the month of November.
There were 1,500 properties listed in November, an increase of 11.4 per cent compared to November of last year.
“This is the fifth month this year for record-breaking monthly sales,” said RAHB CEO George O’Neill. “Even though new listings are up from last year, the brisk sales we’ve seen all year leave us with low inventory at the end of November. It is interesting to note that for all the monthly records set this year, year-to-date sales are very slightly below what they were last year at this time. – less than one per cent lower. It’s a testament to just how hot the real estate market has been for the last two years.”
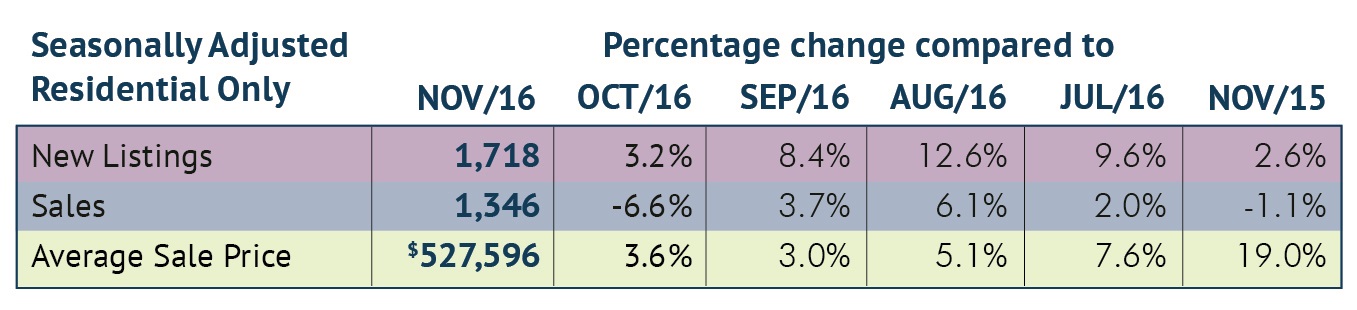
Seasonally adjusted* sales of residential properties were 1.1 per cent lower than the same month last year, with the average sale price up 19 per cent for the month. Seasonally adjusted numbers of new listings were 2.6 per cent higher than November of 2015.
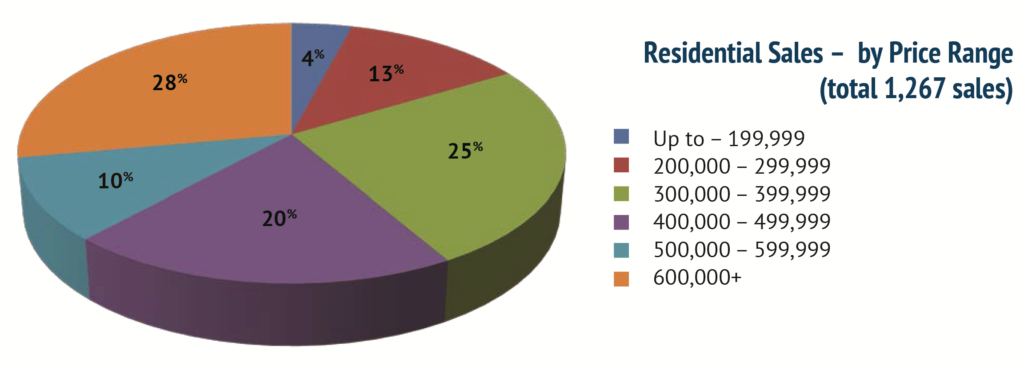
Seasonally adjusted data for residential properties for the month of November, 2016:
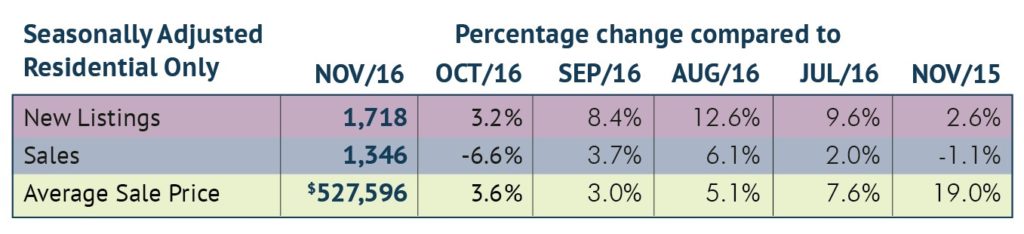
Overall residential sales of 1,267 units were 5.3 per cent higher than the same month last year. Residential freehold sales were 2.9 per cent higher than November of 2015 while sales in the condominium market were 16.6 per cent higher than the same month last year.
The median price of freehold properties increased by 21.1 per cent over the same month last year while the median price for condominium properties increased by 26.7 per cent compared to the same period.
The average price of freehold properties showed an increase of 20.2 per cent compared to November of last year; the average sale price in the condominium market increased by 23.5 per cent when compared to the same period.
Average sale price is based on the total dollar volume of all properties sold through the RAHB MLS® System. Average sale price can be useful in establishing long-term trends, but should not be used as an indicator that specific properties have increased or decreased in value. Contact a REALTOR® for information about your area or property.
The average number of days on market decreased from 36 to 25 days in the freehold market and from 34 to 26 days in the condominium market, compared to November of last year.
“It isn’t taking long at all for properties to move in this market,” noted RAHB President Kim Alvarez. “It’s always a good idea to use the services of REALTOR® when you buy or sell your home, but especially important when properties sell as quickly as they do now.”
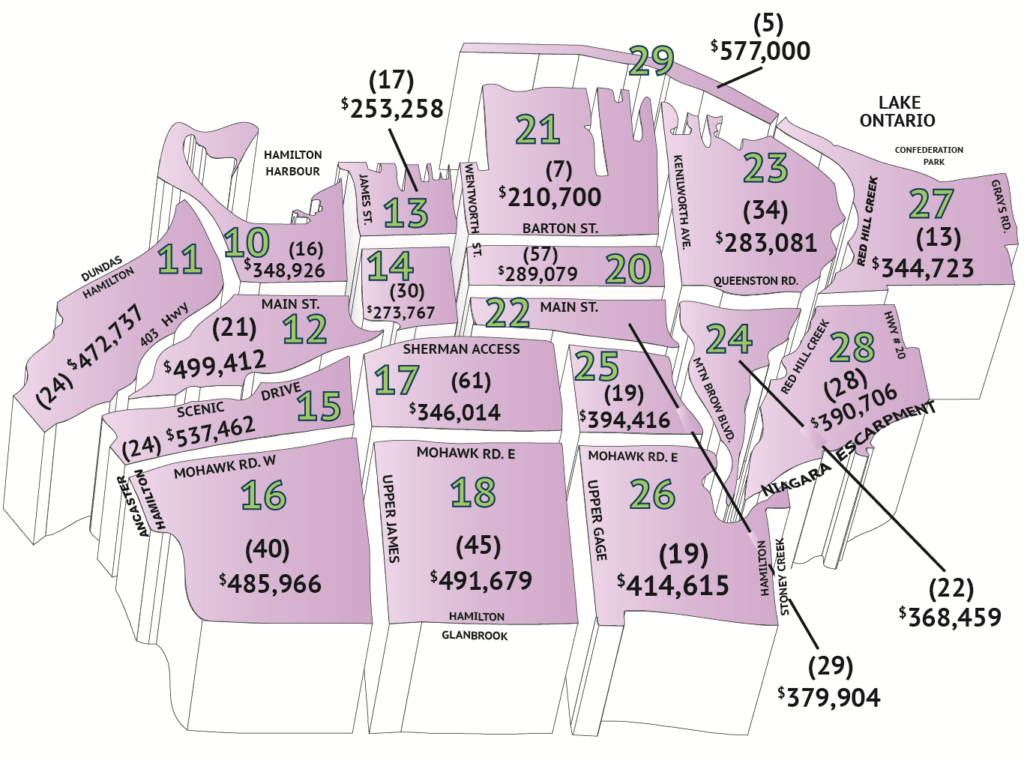
Every community in RAHB’s market area has its own localized market. Please refer to the accompanying chart, and contact a REALTOR® for more information.

*Seasonal adjustment removes normal seasonal variations, enabling analysis of monthly changes and fundamental trends in the data.
About the REALTORS® Association of Hamilton-Burlington
Established in 1921, the REALTORS® Association of Hamilton-Burlington (RAHB) represents more than 3,000 real estate brokers and sales representatives from Hamilton, Burlington and outlying areas. Members of the Association may use the REALTOR® trademark, which identifies them as real estate professionals who subscribe to a strict code of ethics. The Association operates the local Multiple Listing Service® (MLS®) System and provides ongoing professional education courses for its members. Advertisements of local MLS® property listings and information about the services provided by a REALTOR® can be found at REALTOR.ca. More information about RAHB is available at rahb.ca.
|
Dec 7, 2016 | MLS®, Stats & Technology |

Dec 7, 2016 | MLS®, Stats & Technology |
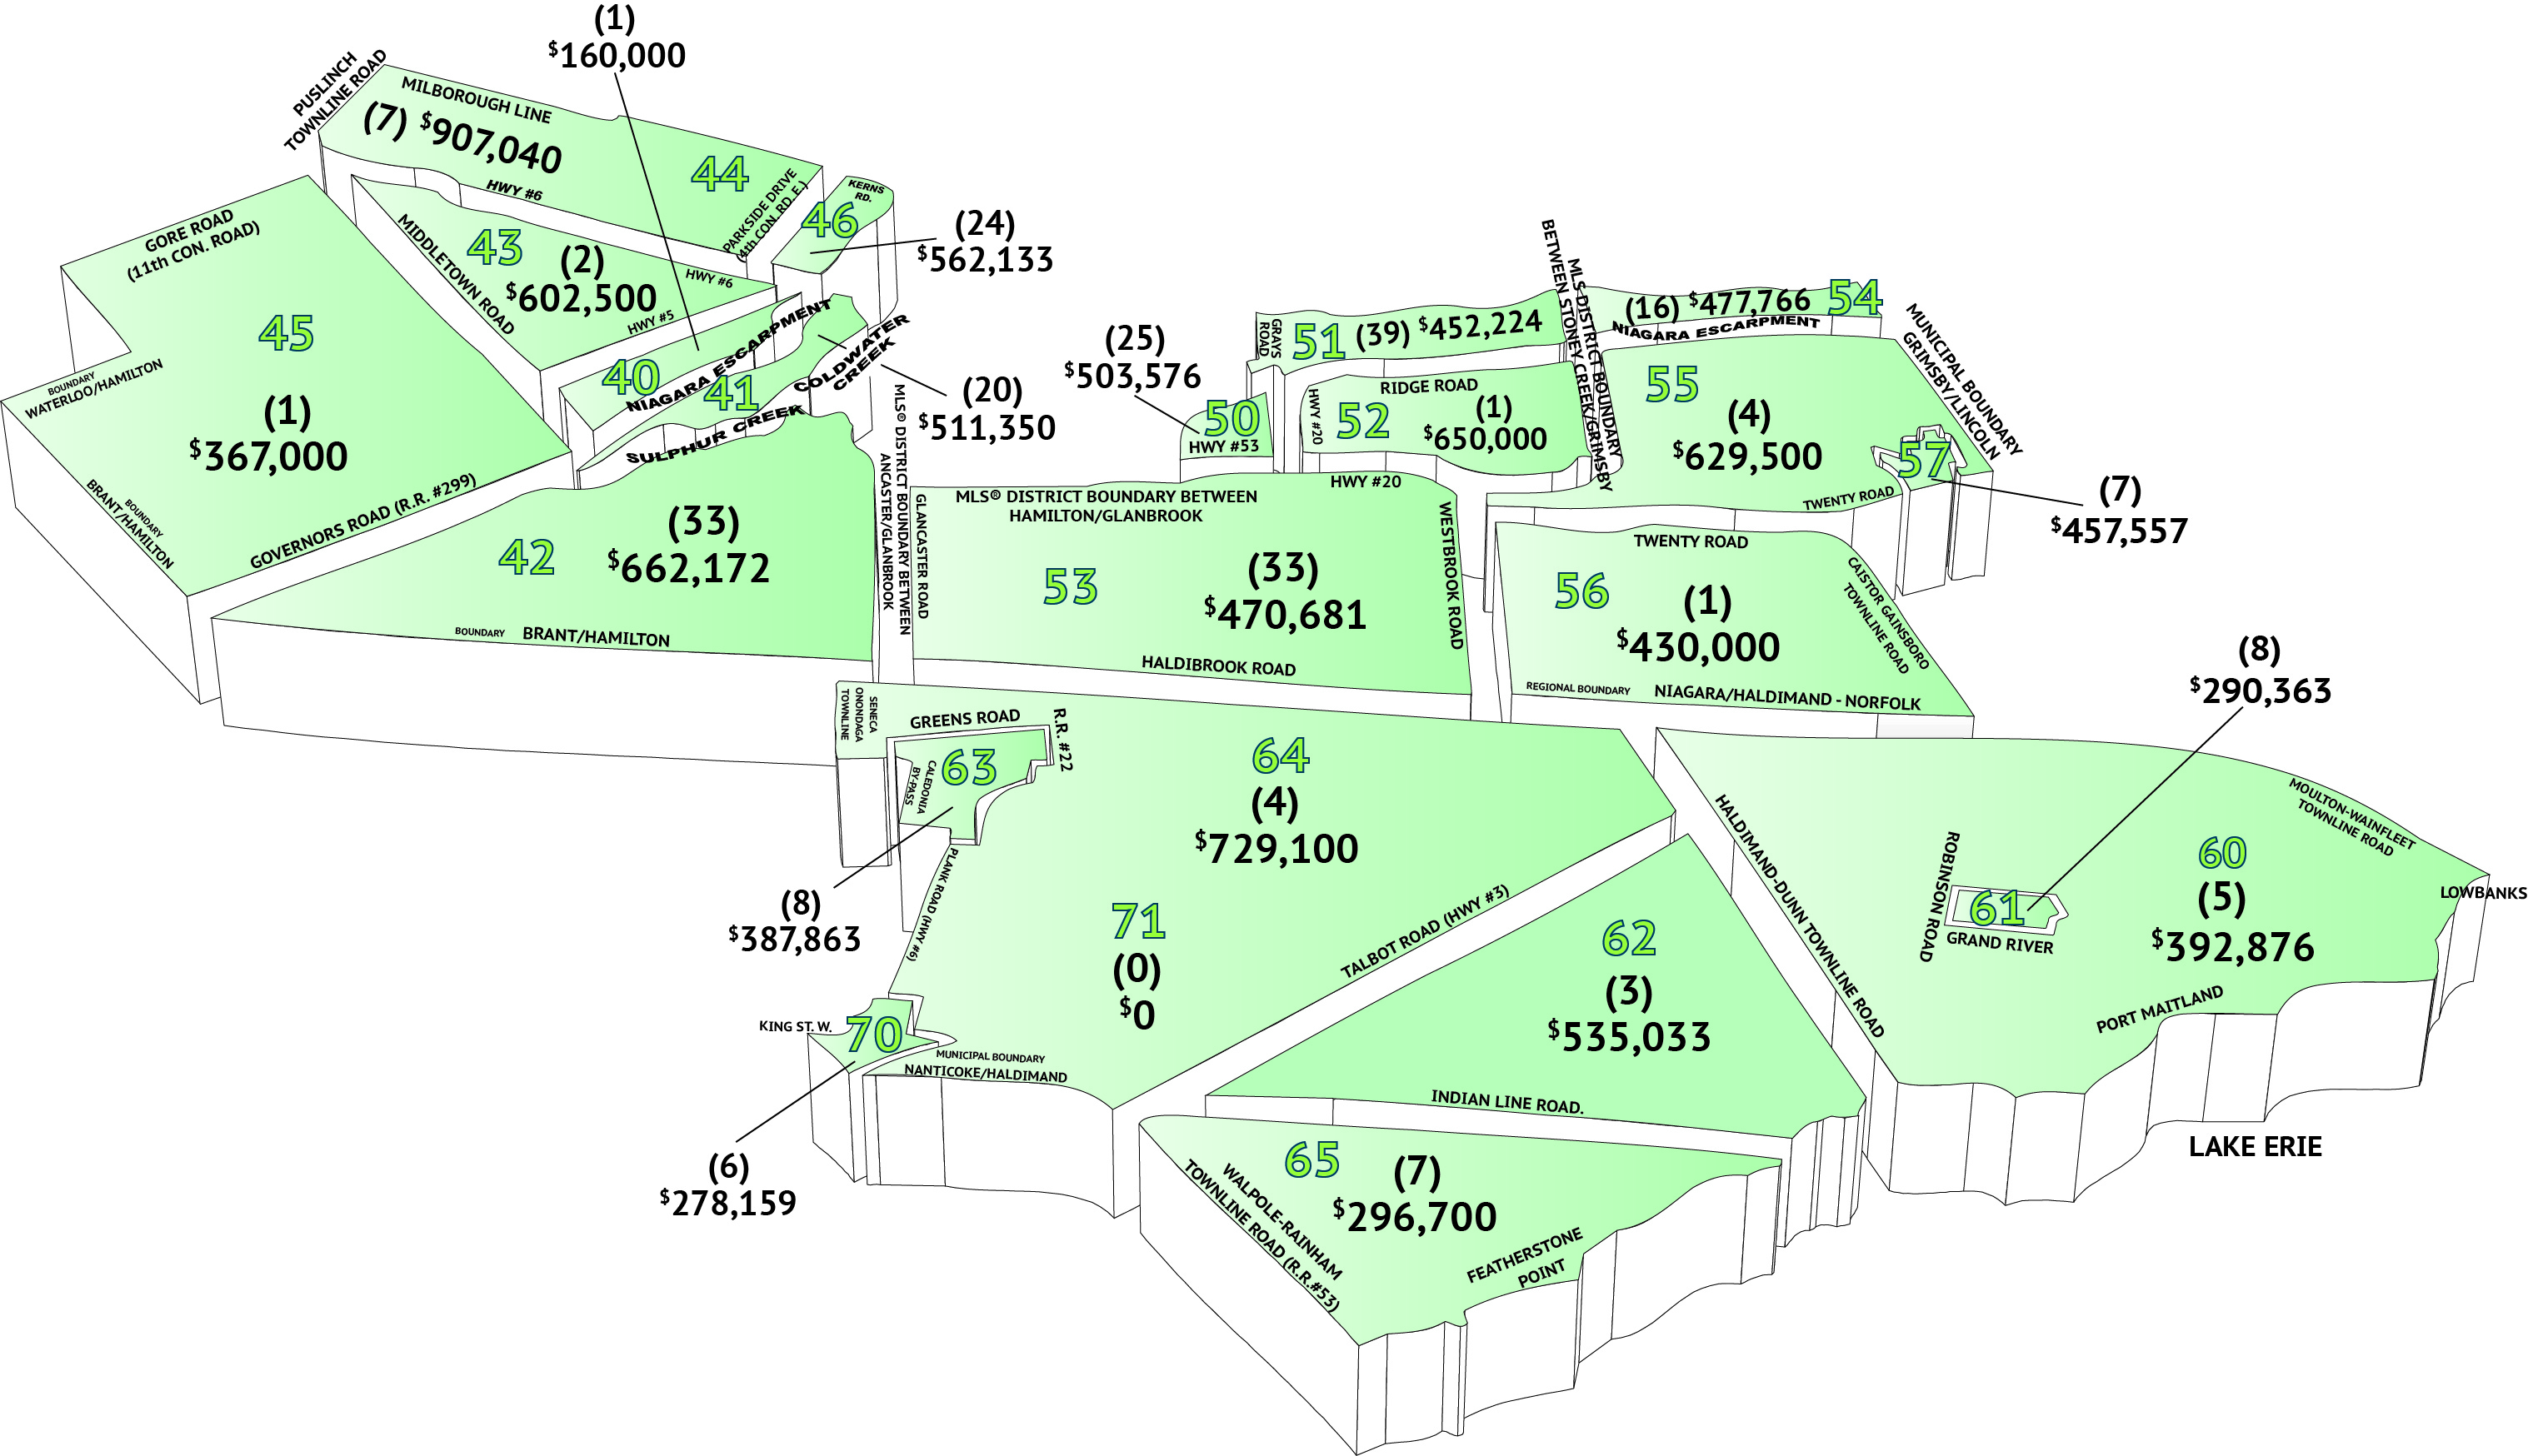
RAHB Average Price by District – (#) Residential Unit Sales
Hamilton
Hamilton West, 10 – 12
Hamilton East, 23, 24, 27 – 29
Hamilton Centre, 13, 14, 20 – 22
Hamilton Mountain, 15 – 18, 25 & 26
Burlington 30 – 36, 38

Outlying
Flamborough, 40, 43 – 45
Dundas, 41
Ancaster, 42
Waterdown, 46
Stoney Creek, 50 – 52
Glanbrook, 53
Grimsby, 54 -55
West Lincoln, 56
Smithville, 57
Dunnville, 61
Cayuga, 62
Calendonia/Hagersville, 63 & 70
Onieda/Seneca, 71 & 64
Rainham, 65
Canborough/Dunn, 60

Nov 8, 2016 | MLS®, Stats & Technology |


Nov 8, 2016 | MLS®, Stats & Technology |
RAHB Average Price by District – (#) Residential Unit Sales
Hamilton
Hamilton West, 10 – 12
Hamilton East, 23, 24, 27 – 29
Hamilton Centre, 13, 14, 20 – 22
Hamilton Mountain, 15 – 18, 25 & 26
Burlington 30 – 36, 38

Outlying
Flamborough, 40, 43 – 45
Dundas, 41
Ancaster, 42
Waterdown, 46
Stoney Creek, 50 – 52
Glanbrook, 53
Grimsby, 54 -55
West Lincoln, 56
Smithville, 57
Dunnville, 61
Cayuga, 62
Calendonia/Hagersville, 63 & 70
Onieda/Seneca, 71 & 64
Rainham, 65
Canborough/Dunn, 60


