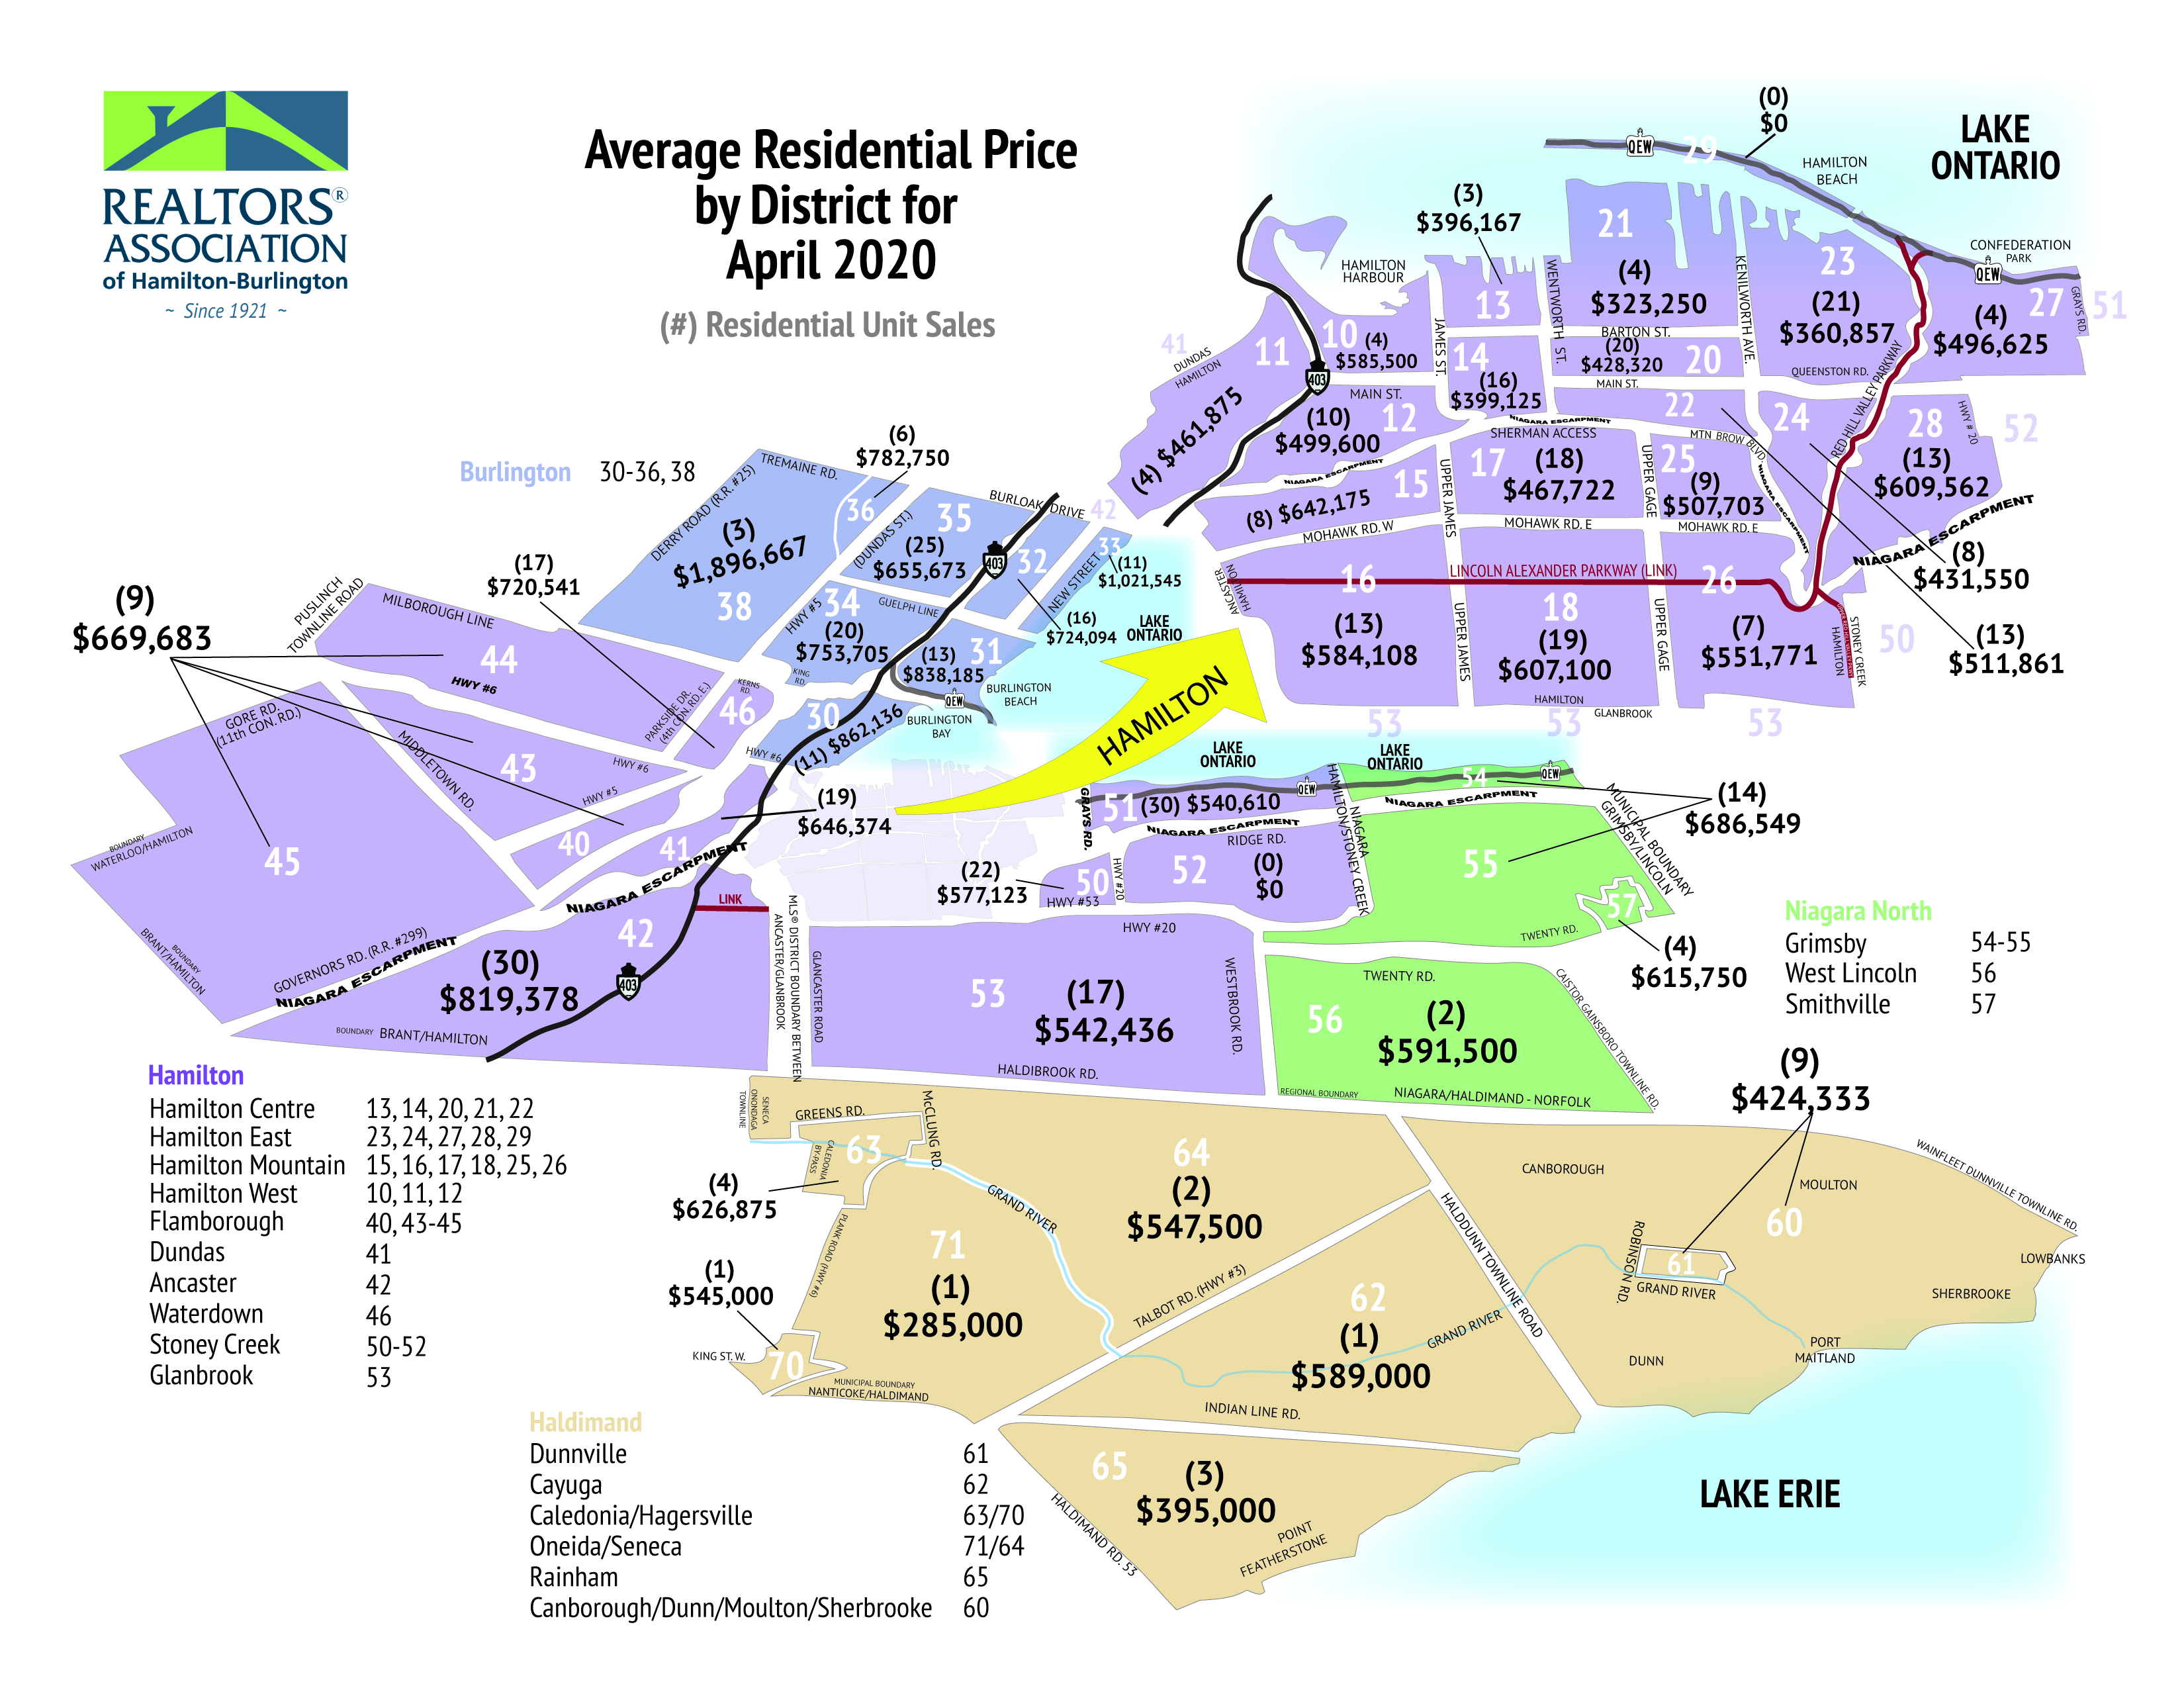
The REALTORS® Association of Hamilton-Burlington (RAHB) reported 482 sales of residential properties located within the RAHB market area were processed through the Multiple Listing Service® (MLS®) System in April 2020. Sales are down 63.4 per cent over April 2019 and 56 per cent over last month. The average price for residential properties was $614,412, which is up 4.3 per cent from April last year, but down 6.6 per cent from last month.
Follow the links below for:
- Residential Market Activity for RAHB Area
- All RAHB Residential Market Activity and HPI Report (17 pages)
- RAHB Residential Market at a Glance
- Weekly Trends for March and April *NEW*
- Social Media Stats Kit
- Stats Map for Entire RAHB Area
- RAHB Commercial Activity
- Residential + Commercial Activity for RAHB Market Areas
- Historical Chart
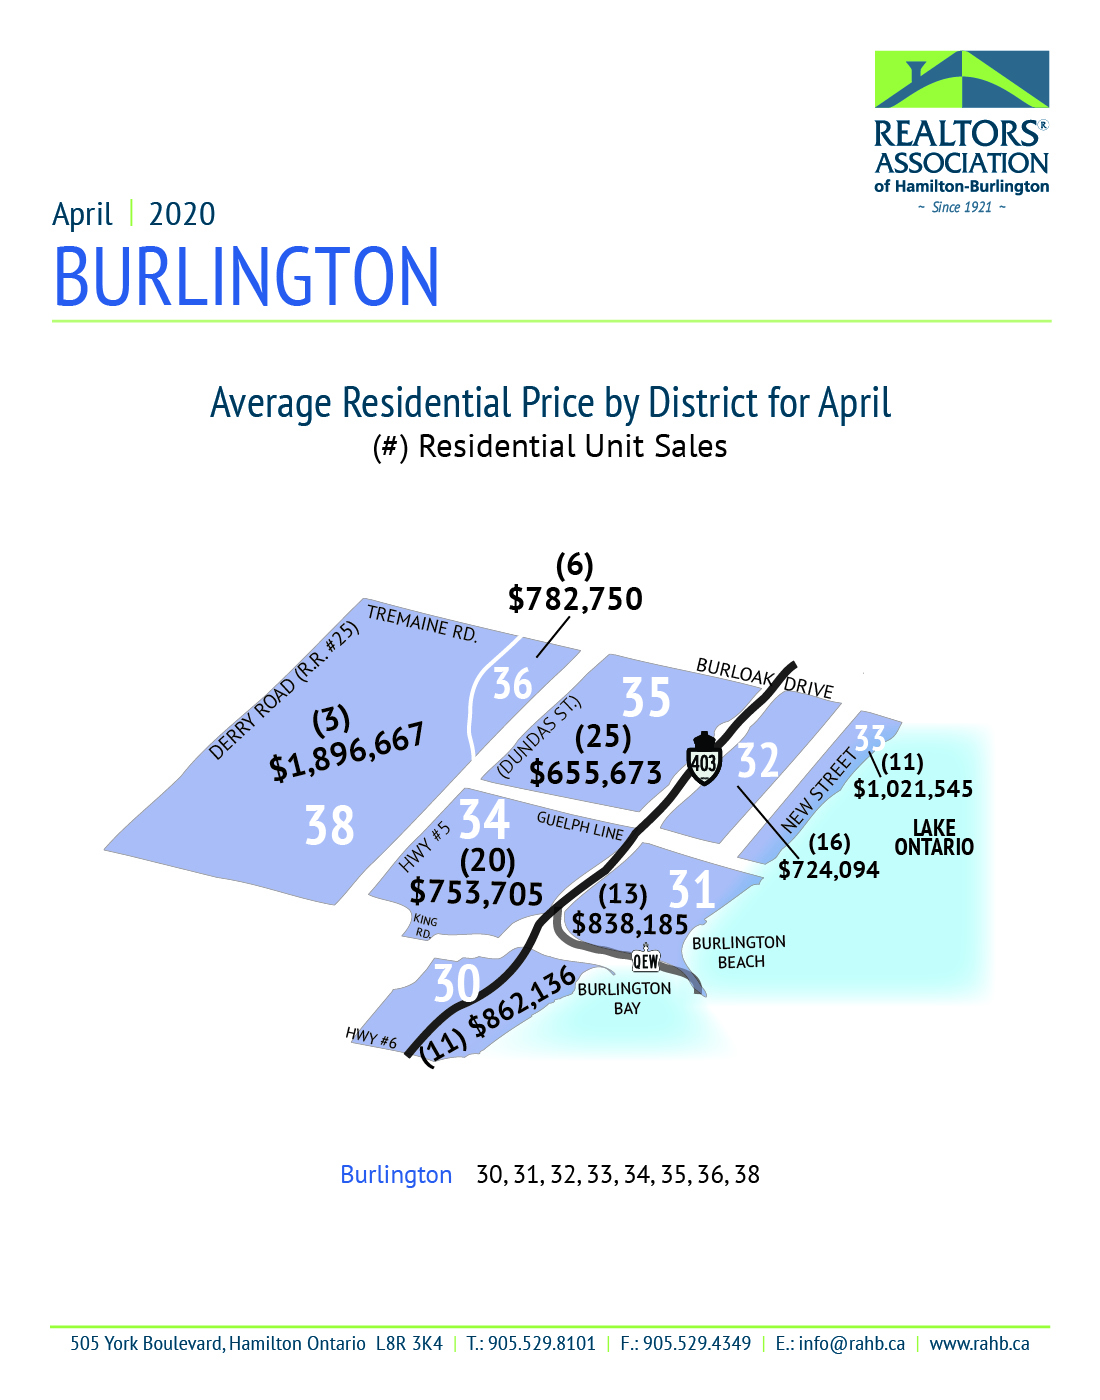
Burlington
- Residential Real Estate Market Activity Table for Burlington
- Burlington Market Activity and HPI Report (72 pages)
- Burlington Area Map
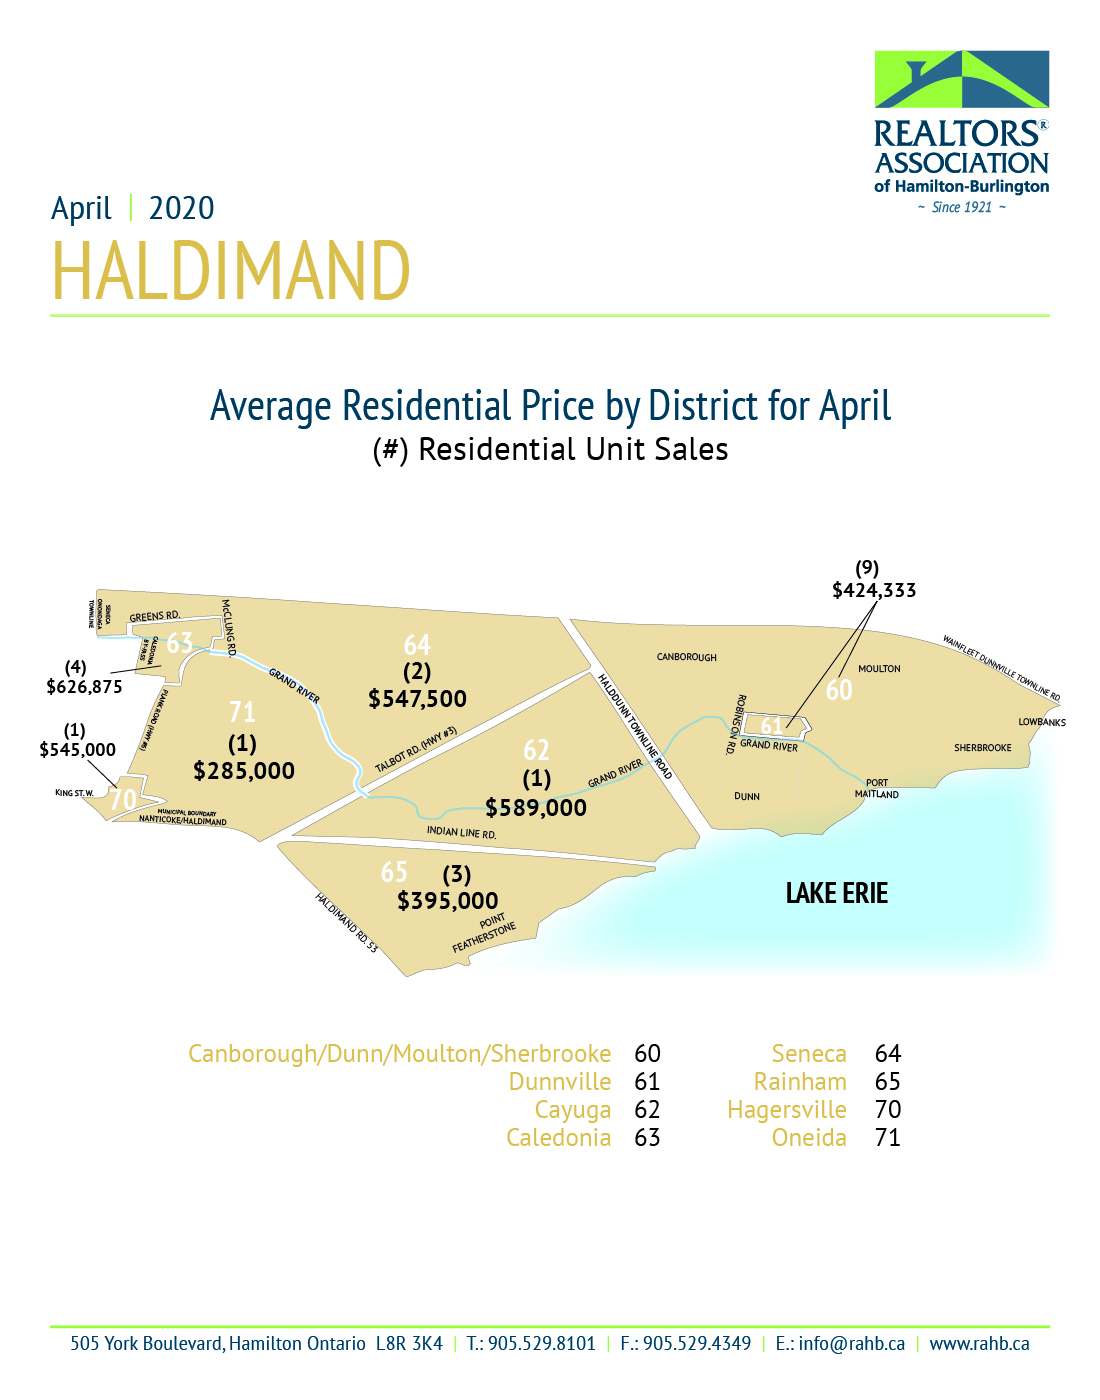
Halidmand
- Residential Real Estate Market Activity Table for Haldimand
- Haldimand Market Activity and HPI Report (58 pages)
- Haldimand Area Map
Hamilton
- Residential Real Estate Market Activity Table for Hamilton
- Hamilton Market Activity and HPI Report (197 pages)
- Hamilton Area Map
Niagara North
- Residential Real Estate Market Activity Table for Niagara North
- Niagara North Market Activity and HPI Report (31 pages)
- Niagara North Area Map
Hi,
This is April report 2020 Hamilton and Burlington area.
If you have any question , call me anytime.
Hi Sam, we have several reports that cover Hamilton, Burlington, Haldimand and Niagara North. If you have any questions about one of the specific reports please contact me at laureno@rahb.ca for further clarification.